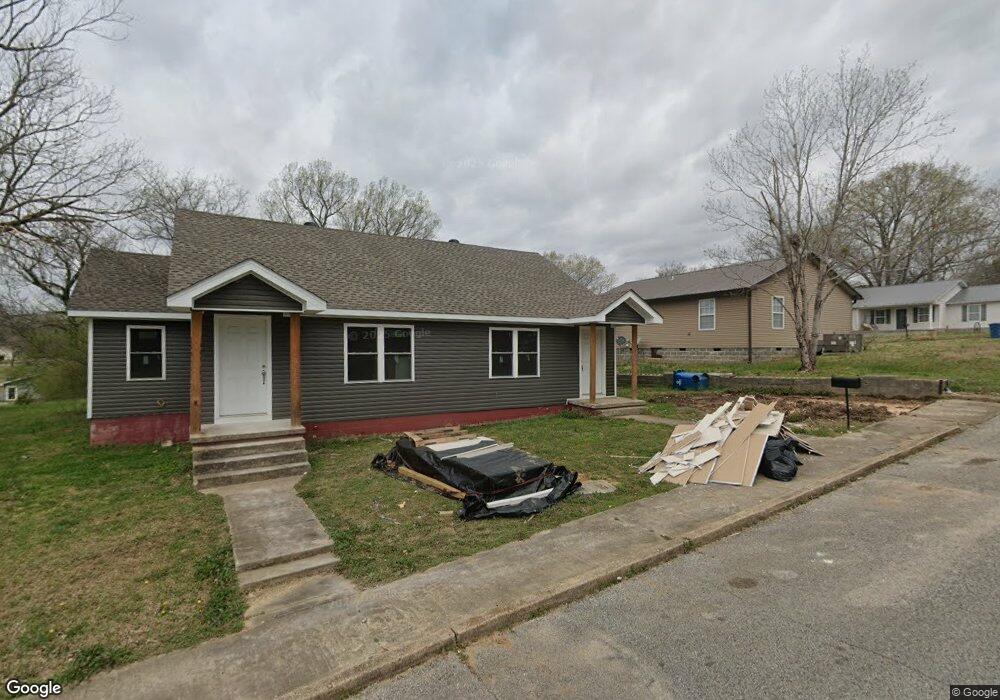
119 Maple Ave Unit 1 Camden, TN 38320
Estimated Value: $194,000 - $248,000
1
Bed
1
Bath
956
Sq Ft
$227/Sq Ft
Est. Value
About This Home
This home is located at 119 Maple Ave Unit 1, Camden, TN 38320 and is currently estimated at $217,319, approximately $227 per square foot. 119 Maple Ave Unit 1 is a home located in Benton County with nearby schools including Camden Elementary School, Briarwood School, and Camden Junior High School.
Ownership History
Date
Name
Owned For
Owner Type
Purchase Details
Closed on
Oct 15, 2025
Sold by
Mccall Charles Austin
Bought by
Tummons Samuel Waine Hargis
Current Estimated Value
Home Financials for this Owner
Home Financials are based on the most recent Mortgage that was taken out on this home.
Original Mortgage
$204,250
Outstanding Balance
$203,693
Interest Rate
6.5%
Mortgage Type
New Conventional
Estimated Equity
$13,626
Purchase Details
Closed on
Jan 17, 2025
Sold by
Salazar Richard and Salazar Jessica
Bought by
Mccall Charles
Home Financials for this Owner
Home Financials are based on the most recent Mortgage that was taken out on this home.
Original Mortgage
$154,500
Interest Rate
6.69%
Mortgage Type
Construction
Purchase Details
Closed on
May 9, 2023
Sold by
Hollingsworth Timothy G
Bought by
Salazar Richard and Salazar Jessica
Home Financials for this Owner
Home Financials are based on the most recent Mortgage that was taken out on this home.
Original Mortgage
$2,000
Interest Rate
6.32%
Mortgage Type
Seller Take Back
Purchase Details
Closed on
Dec 28, 2022
Sold by
Bowden Randall
Bought by
Hollingsworth Timothy C
Purchase Details
Closed on
Dec 13, 2022
Sold by
Mullins Fayette D
Bought by
Bowden Randall
Purchase Details
Closed on
May 19, 2016
Sold by
Mullins Beverly Faye
Bought by
Townsen William Richard and Townsen Marcella A
Purchase Details
Closed on
Nov 22, 2015
Sold by
Townsen W Richard Marcella M
Bought by
Mullins Beverly
Purchase Details
Closed on
Jul 17, 1997
Sold by
Barker Lucy H
Bought by
Richard Townsen W
Purchase Details
Closed on
Oct 29, 1993
Bought by
Barker Lucy H
Create a Home Valuation Report for This Property
The Home Valuation Report is an in-depth analysis detailing your home's value as well as a comparison with similar homes in the area
Home Values in the Area
Average Home Value in this Area
Purchase History
| Date | Buyer | Sale Price | Title Company |
|---|---|---|---|
| Tummons Samuel Waine Hargis | $215,000 | None Listed On Document | |
| Mccall Charles | $73,500 | None Listed On Document | |
| Salazar Richard | $30,000 | None Listed On Document | |
| Hollingsworth Timothy C | $20,000 | -- | |
| Bowden Randall | $10,000 | -- | |
| Townsen William Richard | -- | -- | |
| Mullins Beverly | -- | -- | |
| Mullins Beverly Faye | -- | -- | |
| Richard Townsen W | $44,500 | -- | |
| Barker Lucy H | $28,500 | -- |
Source: Public Records
Mortgage History
| Date | Status | Borrower | Loan Amount |
|---|---|---|---|
| Open | Tummons Samuel Waine Hargis | $204,250 | |
| Previous Owner | Mccall Charles | $154,500 | |
| Previous Owner | Salazar Richard | $2,000 | |
| Previous Owner | Salazar Richard | $24,000 |
Source: Public Records
Map
Nearby Homes
- 122 W Lake St
- 1 Maple Ave
- 6100 Old Highway 69s
- 134 N Church Ave
- 130 Turnpike Ave
- 113 S Forrest Ave
- 147 Berry St
- 129 S Forrest Ave
- 120 Magnolia St
- 172 W Main St
- 181 Washington Ave
- 000 Wyly St
- 162 Factory St
- 0 Forrest Ave N
- 241 Stigall St
- 170 Westview St
- 103 Highway 641 N
- 273 Washington Ave
- 98 Oak Hill St
- 130 Mimosa St
- 119 Maple Ave Unit 2
- 115 Vine St
- 115 Maple Ave
- 117 Vine St
- 0 Eagle Ck Rd N Unit 1616543
- 116 Vine St
- 112 Washington Ave
- 114 Vine St
- 118 Vine St
- 108 Washington
- 108 Vine St
- 124 Madden St
- 117 N Forrest Ave
- 0 Maple St Unit RTC2696757
- 124 W Lake St
- 123 N Forrest Ave
- 117 Washington Ave
- 115 Washington Ave
- 128 W Lake St
- 133 Madden St
Your Personal Tour Guide
Ask me questions while you tour the home.