
Landlord's Agent in 2018
Ryan Rebant
Mountain Home Real Estate, LLC
(304) 702-3086
181 in this area
286 Total Sales
Estimated Value: $283,000 - $368,000
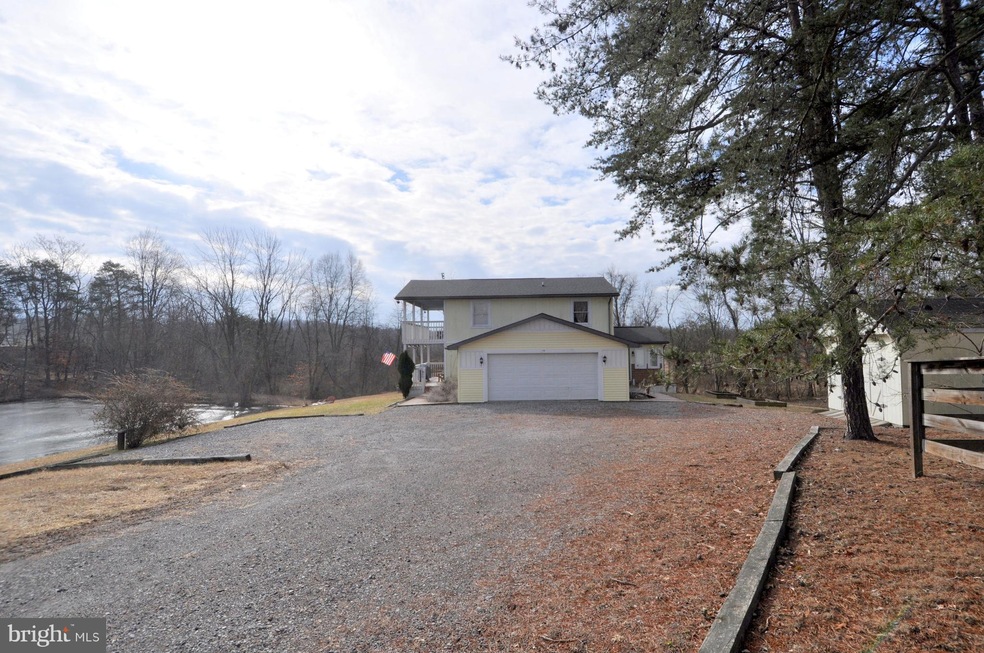
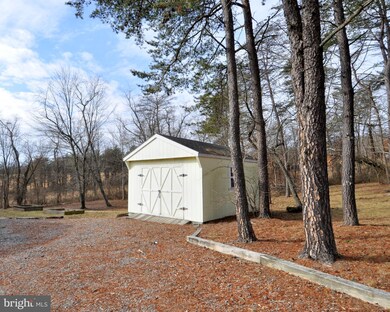
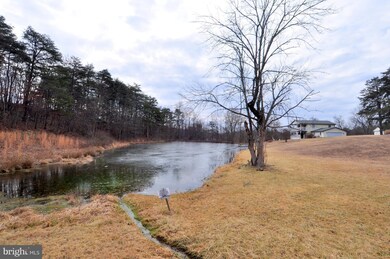
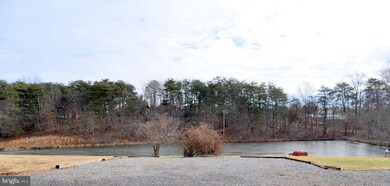
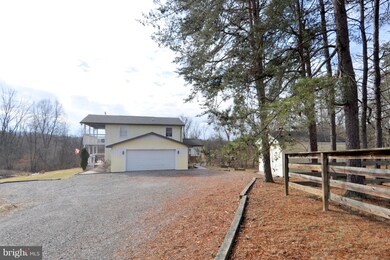
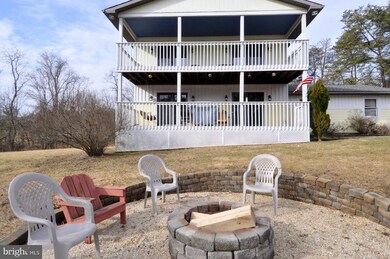
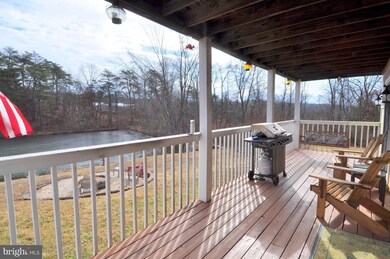
3BR 2BA rental home, well maintained, pond, attached garage, hardwood floors, nice yard, and much more. No smoking, pets on a case by case basis. Close to town (about 2 miles from Berkeley Springs). Intend to rent the property fully furnished. Federal fair housing laws apply.
Last Agent to Rent the Property
(304) 702-3086 rjrebant@hotmail.com Mountain Home Real Estate, LLC License #WV0028275 Listed on: 01/31/2018
Last Renter's Agent
(304) 702-3086 rjrebant@hotmail.com Mountain Home Real Estate, LLC License #WV0028275 Listed on: 01/31/2018
| Date | Event | Price | List to Sale | Price per Sq Ft | Prior Sale |
|---|---|---|---|---|---|
| 02/26/2018 02/26/18 | Rented | $1,350 | 0.0% | -- | |
| 02/26/2018 02/26/18 | Under Contract | -- | -- | -- | |
| 01/31/2018 01/31/18 | For Rent | $1,350 | 0.0% | -- | |
| 04/27/2012 04/27/12 | Sold | $136,500 | -17.3% | $68 / Sq Ft | View Prior Sale |
| 03/13/2012 03/13/12 | Pending | -- | -- | -- | |
| 02/21/2012 02/21/12 | For Sale | $165,000 | -- | $83 / Sq Ft |
| Year | Tax Paid | Tax Assessment Tax Assessment Total Assessment is a certain percentage of the fair market value that is determined by local assessors to be the total taxable value of land and additions on the property. | Land | Improvement |
|---|---|---|---|---|
| 2025 | $2,195 | $110,400 | $22,920 | $87,480 |
| 2024 | $2,195 | $101,400 | $21,000 | $80,400 |
| 2023 | $2,029 | $99,480 | $21,000 | $78,480 |
| 2022 | $1,972 | $98,520 | $21,000 | $77,520 |
| 2021 | $1,916 | $95,760 | $21,000 | $74,760 |
| 2020 | $2,003 | $100,080 | $21,000 | $79,080 |
| 2019 | $1,991 | $99,480 | $21,000 | $78,480 |
| 2018 | $1,940 | $96,960 | $21,000 | $75,960 |
| 2017 | $1,942 | $97,020 | $21,000 | $76,020 |
| 2016 | $1,943 | $97,080 | $21,000 | $76,080 |
| 2015 | $1,025 | $102,480 | $17,700 | $84,780 |
| 2014 | -- | $96,720 | $19,320 | $77,400 |
Landlord's Agent in 2018
Ryan Rebant
Mountain Home Real Estate, LLC
(304) 702-3086
181 in this area
286 Total Sales
Seller's Agent in 2012
Tammy White
Kesecker Realty, Inc.
(304) 582-0090
71 in this area
84 Total Sales
Buyer's Agent in 2012
Mary Frazee
Long & Foster
(304) 671-4739
1 in this area
100 Total Sales
Source: Bright MLS
MLS Number: 1005899645
APN: 01-13A-00230000
Disclaimer: Certain information contained herein is derived from information provided by parties other than Homes.com. All information provided is deemed reliable, but is not guaranteed to be accurate and should be independently verified.
![]() The data relating to real estate for sale on this website appears in part through the BRIGHT Internet Data Exchange program, a voluntary cooperative exchange of property listing data between licensed real estate brokerage firms, and is provided by BRIGHT through a licensing agreement.
The data relating to real estate for sale on this website appears in part through the BRIGHT Internet Data Exchange program, a voluntary cooperative exchange of property listing data between licensed real estate brokerage firms, and is provided by BRIGHT through a licensing agreement.
Listing information is from various brokers who participate in the Bright MLS IDX program and not all listings may be visible on the site.
The property information being provided on or through the website is for the personal, non-commercial use of consumers and such information may not be used for any purpose other than to identify prospective properties consumers may be interested in purchasing.
Some properties which appear for sale on the website may no longer be available because they are for instance, under contract, sold or are no longer being offered for sale.
Property information displayed is deemed reliable but is not guaranteed.
Copyright 2025 Bright MLS, Inc.