E
Seller's Agent in 2025
Emma Meuse
Hearth & Key Realty
(207) 241-2327
1 in this area
1 Total Sale

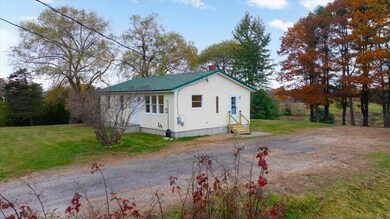
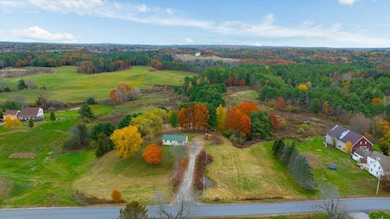

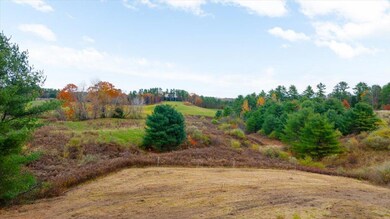

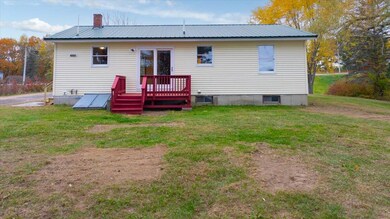
Discover peaceful country living just minutes from town. Nestled on 5.1 private acres in desirable Gorham, this well-maintained ranch-style home offers the perfect balance of convenience and tranquility. Set on a quiet road with beautiful open views, you'll feel worlds away-yet schools, shops, and restaurants are just a short drive. Enjoy single floor living with a bright, functional layout and room to grow. The spacious basement offers great potential to finish for additional living space, a home gym, or family room. Step outside and enjoy the rural charm- ample room for gardens, play, or simply relaxing. A rare opportunity to own acreage in Gorham where comfort, privacy, and location come together beautifully.
Last Agent to Sell the Property
Hearth & Key Realty Brokerage Phone: 2072036579 Listed on: 10/27/2025

| Date | Type | Sale Price | Title Company |
|---|---|---|---|
| Warranty Deed | $440,000 | -- | |
| Interfamily Deed Transfer | -- | -- | |
| Warranty Deed | -- | -- | |
| Warranty Deed | -- | -- |
| Date | Status | Loan Amount | Loan Type |
|---|---|---|---|
| Open | $396,000 | New Conventional | |
| Previous Owner | $120,000 | New Conventional |
| Date | Event | Price | List to Sale | Price per Sq Ft |
|---|---|---|---|---|
| 11/21/2025 11/21/25 | Sold | $440,000 | -2.2% | $458 / Sq Ft |
| 10/31/2025 10/31/25 | Pending | -- | -- | -- |
| 10/27/2025 10/27/25 | For Sale | $450,000 | -- | $469 / Sq Ft |
| Year | Tax Paid | Tax Assessment Tax Assessment Total Assessment is a certain percentage of the fair market value that is determined by local assessors to be the total taxable value of land and additions on the property. | Land | Improvement |
|---|---|---|---|---|
| 2025 | $4,576 | $309,200 | $126,100 | $183,100 |
| 2024 | $4,545 | $309,200 | $126,100 | $183,100 |
| 2023 | $4,252 | $309,200 | $126,100 | $183,100 |
| 2022 | $3,973 | $309,200 | $126,100 | $183,100 |
| 2021 | $3,203 | $165,100 | $83,000 | $82,100 |
| 2020 | $3,137 | $165,100 | $83,000 | $82,100 |
| 2019 | $3,129 | $165,100 | $83,000 | $82,100 |
| 2018 | $7,098 | $165,100 | $83,000 | $82,100 |
| 2017 | $2,823 | $165,100 | $83,000 | $82,100 |
| 2016 | $2,810 | $165,300 | $83,200 | $82,100 |
| 2015 | $2,694 | $165,300 | $83,200 | $82,100 |
| 2014 | $2,488 | $143,000 | $76,600 | $66,400 |
| 2013 | $2,474 | $143,000 | $76,600 | $66,400 |
E
Seller's Agent in 2025
Emma Meuse
Hearth & Key Realty
(207) 241-2327
1 in this area
1 Total Sale
R
Buyer's Agent in 2025
Rhea Kafer
Keller Williams Realty
3 in this area
62 Total Sales
Source: Maine Listings
MLS Number: 1642023
APN: GRHM-000067-000002
Disclaimer: Certain information contained herein is derived from information provided by parties other than Homes.com. All information provided is deemed reliable, but is not guaranteed to be accurate and should be independently verified.
![]() Listing data is derived in whole or in part from Maine Real Estate Information System, Inc. (d/b/a Maine Listings) and is for consumers' personal, noncommercial use only. Dimensions are approximate and not guaranteed. All data should be independently verified.
Listing data is derived in whole or in part from Maine Real Estate Information System, Inc. (d/b/a Maine Listings) and is for consumers' personal, noncommercial use only. Dimensions are approximate and not guaranteed. All data should be independently verified.
© 2026 Maine Real Estate Information System, Inc. All Rights Reserved. Equal Housing Opportunity.
Homes.com, LLC, 17600 Laguna Canyon Rd Irvine, CA 92618 (888)-952-6393
![]()
Ask me questions while you tour the home.