Estimated Value: $857,493
--
Bed
--
Bath
17,740
Sq Ft
$48/Sq Ft
Est. Value
About This Home
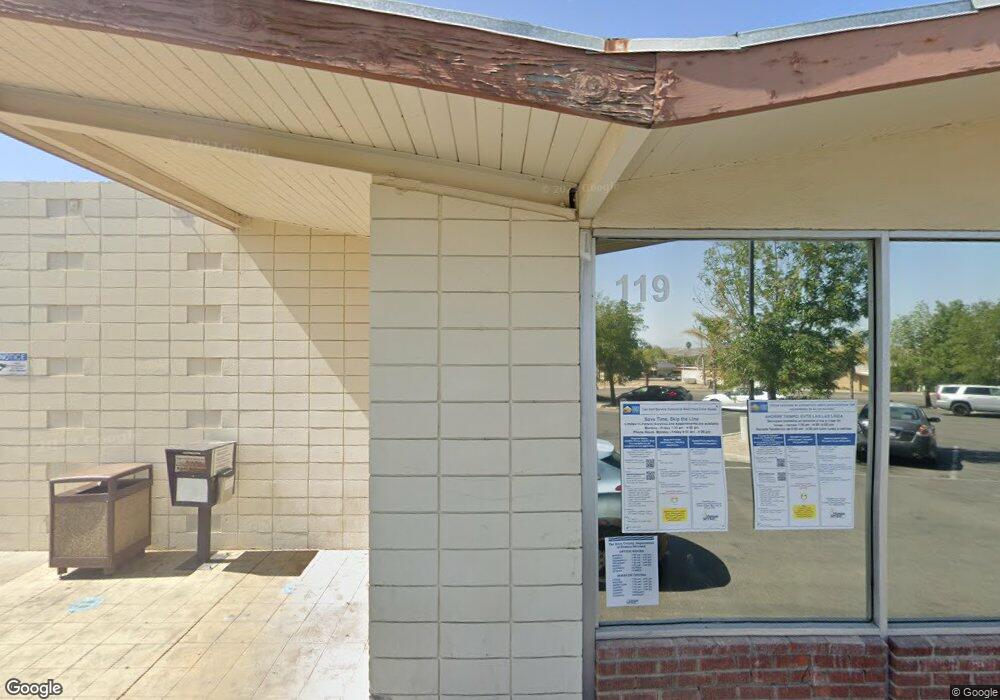
This home is located at 119 N 10th St, Taft, CA 93268 and is currently estimated at $857,493, approximately $48 per square foot. 119 N 10th St is a home located in Kern County with nearby schools including Roosevelt Elementary School, Parkview Elementary School, and Lincoln Junior High School.
Ownership History
Date
Name
Owned For
Owner Type
Purchase Details
Closed on
Dec 29, 2020
Sold by
Taft Tenth Street Plaza Llc
Bought by
Taft Tenth Street Plaza Llc
Current Estimated Value
Home Financials for this Owner
Home Financials are based on the most recent Mortgage that was taken out on this home.
Original Mortgage
$1,000,000
Outstanding Balance
$892,346
Interest Rate
2.7%
Mortgage Type
Commercial
Estimated Equity
-$34,853
Purchase Details
Closed on
Mar 28, 2006
Sold by
Chahlah Chahla and Chahlah Shahla Rami
Bought by
Taft Tenth Street Plaza Llc
Create a Home Valuation Report for This Property
The Home Valuation Report is an in-depth analysis detailing your home's value as well as a comparison with similar homes in the area
Home Values in the Area
Average Home Value in this Area
Purchase History
| Date | Buyer | Sale Price | Title Company |
|---|---|---|---|
| Taft Tenth Street Plaza Llc | -- | Stewart Title | |
| Taft Tenth Street Plaza Llc | -- | Public | |
| Chahlah Chahla | -- | Public |
Source: Public Records
Mortgage History
| Date | Status | Borrower | Loan Amount |
|---|---|---|---|
| Open | Taft Tenth Street Plaza Llc | $1,000,000 |
Source: Public Records
Tax History Compared to Growth
Tax History
| Year | Tax Paid | Tax Assessment Tax Assessment Total Assessment is a certain percentage of the fair market value that is determined by local assessors to be the total taxable value of land and additions on the property. | Land | Improvement |
|---|---|---|---|---|
| 2025 | $5,552 | $483,752 | $191,313 | $292,439 |
| 2024 | $5,552 | $474,267 | $187,562 | $286,705 |
| 2023 | $5,314 | $464,969 | $183,885 | $281,084 |
| 2022 | $5,255 | $455,853 | $180,280 | $275,573 |
| 2021 | $5,401 | $446,916 | $176,746 | $270,170 |
| 2020 | $5,132 | $442,334 | $174,934 | $267,400 |
| 2019 | $5,042 | $442,334 | $174,934 | $267,400 |
| 2018 | $4,915 | $425,159 | $168,142 | $257,017 |
| 2017 | $4,719 | $416,824 | $164,846 | $251,978 |
| 2016 | $5,028 | $408,652 | $161,614 | $247,038 |
| 2015 | $4,570 | $402,515 | $159,187 | $243,328 |
| 2014 | $4,334 | $394,631 | $156,069 | $238,562 |
Source: Public Records
Map
Nearby Homes