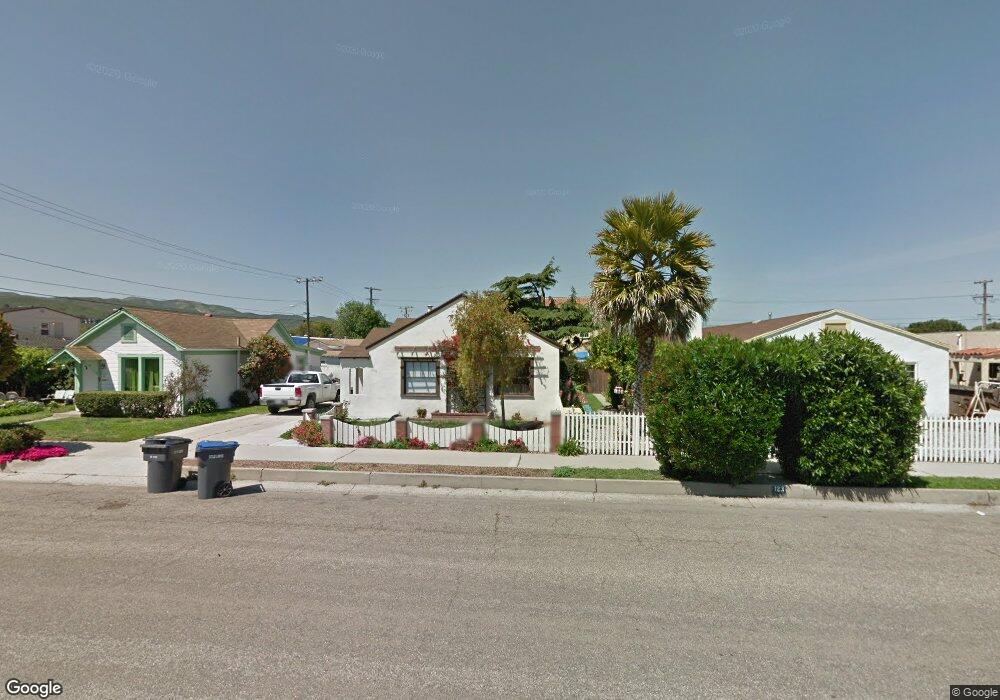
119 N E St Lompoc, CA 93436
Estimated Value: $469,000 - $799,000
3
Beds
2
Baths
1,577
Sq Ft
$376/Sq Ft
Est. Value
About This Home
This home is located at 119 N E St, Lompoc, CA 93436 and is currently estimated at $593,592, approximately $376 per square foot. 119 N E St is a home located in Santa Barbara County with nearby schools including Arthur Hapgood Elementary School, Lompoc Valley Middle School, and Lompoc High School.
Ownership History
Date
Name
Owned For
Owner Type
Purchase Details
Closed on
Aug 30, 2018
Sold by
Clark Paul T
Bought by
Powell Collin S
Current Estimated Value
Home Financials for this Owner
Home Financials are based on the most recent Mortgage that was taken out on this home.
Interest Rate
4.52%
Purchase Details
Closed on
May 30, 2000
Sold by
Beneficial California Inc
Bought by
Clark Richard L and Clark Janet A
Home Financials for this Owner
Home Financials are based on the most recent Mortgage that was taken out on this home.
Original Mortgage
$84,000
Interest Rate
8.53%
Purchase Details
Closed on
Feb 22, 2000
Sold by
Chotirmal Jay & Bobbie and Sammy Chotirmal
Bought by
Beneficial California Inc
Purchase Details
Closed on
Oct 1, 1993
Sold by
Rosario Lester
Bought by
Vista Nirvana Inc
Create a Home Valuation Report for This Property
The Home Valuation Report is an in-depth analysis detailing your home's value as well as a comparison with similar homes in the area
Home Values in the Area
Average Home Value in this Area
Purchase History
| Date | Buyer | Sale Price | Title Company |
|---|---|---|---|
| Powell Collin S | -- | -- | |
| Clark Richard L | $120,000 | Chicago Title Co | |
| Beneficial California Inc | $114,000 | First American Title | |
| Vista Nirvana Inc | -- | First American Title |
Source: Public Records
Mortgage History
| Date | Status | Borrower | Loan Amount |
|---|---|---|---|
| Closed | Powell Collin S | -- | |
| Previous Owner | Clark Richard L | $84,000 | |
| Closed | Powell Collin S | $0 |
Source: Public Records
Tax History
| Year | Tax Paid | Tax Assessment Tax Assessment Total Assessment is a certain percentage of the fair market value that is determined by local assessors to be the total taxable value of land and additions on the property. | Land | Improvement |
|---|---|---|---|---|
| 2025 | $4,254 | $390,426 | $122,704 | $267,722 |
| 2023 | $4,254 | $375,268 | $117,941 | $257,327 |
| 2022 | $4,181 | $367,911 | $115,629 | $252,282 |
| 2021 | $4,228 | $360,698 | $113,362 | $247,336 |
| 2020 | $4,183 | $357,000 | $112,200 | $244,800 |
| 2019 | $4,114 | $350,000 | $110,000 | $240,000 |
| 2018 | $1,934 | $162,083 | $67,534 | $94,549 |
| 2017 | $1,899 | $158,906 | $66,210 | $92,696 |
| 2016 | $1,864 | $155,791 | $64,912 | $90,879 |
| 2015 | $1,850 | $153,451 | $63,937 | $89,514 |
| 2014 | -- | $150,446 | $62,685 | $87,761 |
Source: Public Records
Map
Nearby Homes
Your Personal Tour Guide
Ask me questions while you tour the home.