Estimated Value: $103,000 - $161,000
3
Beds
1
Bath
1,200
Sq Ft
$109/Sq Ft
Est. Value
About This Home
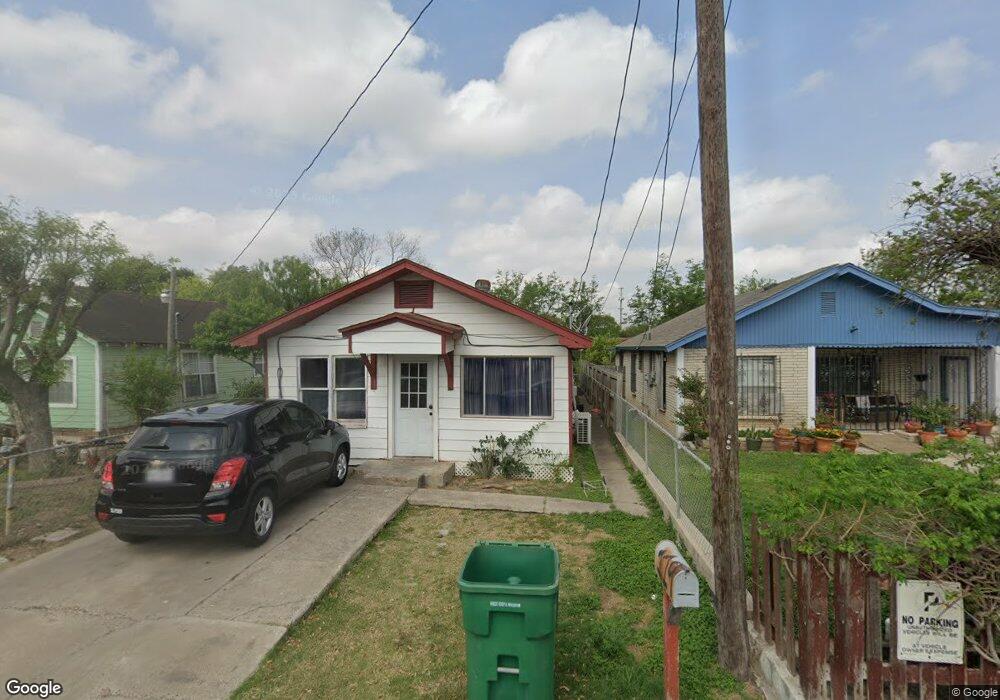
This home is located at 119 N Fir St, Pharr, TX 78577 and is currently estimated at $131,126, approximately $109 per square foot. 119 N Fir St is a home located in Hidalgo County with nearby schools including Henry Ford Elementary, Liberty Middle School, and PSJA North Early College High School.
Ownership History
Date
Name
Owned For
Owner Type
Purchase Details
Closed on
Jun 13, 2022
Sold by
Mendez Mayra M
Bought by
Garcia Juan Gabriel and Perez Teresa Anguiano
Current Estimated Value
Purchase Details
Closed on
Jun 13, 2020
Sold by
Mendez Mayra M
Bought by
Mendez Mayra M
Purchase Details
Closed on
Jan 23, 2015
Sold by
Mendez Mayra M and Garza Juan Antonio
Bought by
Garza Melissa
Purchase Details
Closed on
Jan 12, 2015
Sold by
Garza Janie
Bought by
Mendez Mayra M and Garza Juan Antonio
Purchase Details
Closed on
Mar 12, 2008
Sold by
Militano Gloria and Gonzalez Pete
Bought by
Gonzalez Mary Lou
Purchase Details
Closed on
Feb 13, 2006
Sold by
Garza Janie
Bought by
Garza Juan Antonio and Mendez Mayra M
Home Financials for this Owner
Home Financials are based on the most recent Mortgage that was taken out on this home.
Original Mortgage
$24,400
Interest Rate
13%
Mortgage Type
Seller Take Back
Create a Home Valuation Report for This Property
The Home Valuation Report is an in-depth analysis detailing your home's value as well as a comparison with similar homes in the area
Home Values in the Area
Average Home Value in this Area
Purchase History
| Date | Buyer | Sale Price | Title Company |
|---|---|---|---|
| Garcia Juan Gabriel | -- | None Listed On Document | |
| Mendez Mayra M | -- | None Available | |
| Garza Melissa | -- | None Available | |
| Mendez Mayra M | -- | Attorney | |
| Gonzalez Mary Lou | -- | None Available | |
| Garza Juanita | -- | None Available | |
| Garza Juan Antonio | $29,000 | None Available |
Source: Public Records
Mortgage History
| Date | Status | Borrower | Loan Amount |
|---|---|---|---|
| Previous Owner | Garza Juan Antonio | $24,400 |
Source: Public Records
Tax History Compared to Growth
Tax History
| Year | Tax Paid | Tax Assessment Tax Assessment Total Assessment is a certain percentage of the fair market value that is determined by local assessors to be the total taxable value of land and additions on the property. | Land | Improvement |
|---|---|---|---|---|
| 2025 | $1,467 | $80,153 | $19,219 | $60,934 |
| 2024 | $1,467 | $54,687 | $15,375 | $39,312 |
| 2023 | $1,466 | $54,687 | $15,375 | $39,312 |
| 2022 | $1,456 | $51,900 | $11,750 | $40,150 |
| 2021 | $1,270 | $44,469 | $11,750 | $32,719 |
| 2020 | $1,057 | $36,537 | $11,750 | $24,787 |
| 2019 | $775 | $26,435 | $7,875 | $18,560 |
| 2018 | $791 | $26,847 | $7,875 | $18,972 |
| 2017 | $847 | $28,497 | $7,875 | $20,622 |
| 2016 | $756 | $25,449 | $7,750 | $17,699 |
| 2015 | $852 | $26,143 | $7,750 | $18,393 |
Source: Public Records
Map
Nearby Homes
- 808 E Evans Ave
- 309 E Hawk Ave
- 513 E Hawk Ave
- 1000 E Juarez Ave
- 214 E Clark Ave
- 250 S Cypress St
- 602 E Kelly Ave
- 404 S Dogwood St
- 401 E Gore Ave
- 417 E Chapa Ave
- 212 O'Hare
- 1220 E Lucas Ave
- 813 E Villegas Ave
- 317 S Magnolia St
- 412 S Athol St
- 114 W Clark Ave
- 901 N Huisache St
- 117 W Hawk Ave
- 407 N Veterans Blvd
- 129 E Jones Ave