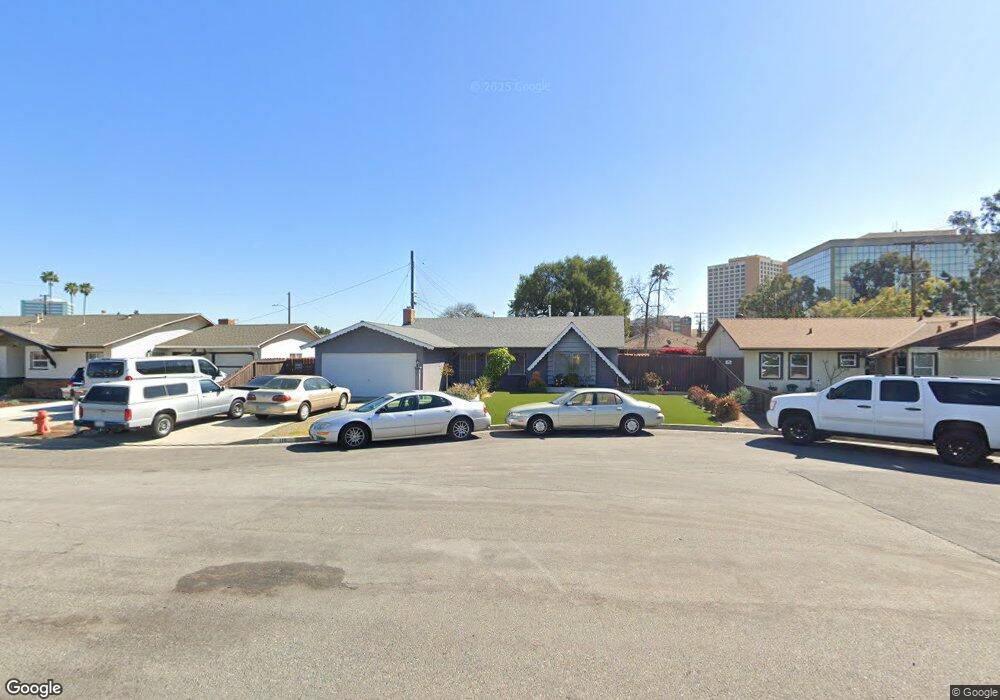
119 N Windgap Dr Orange, CA 92868
Estimated Value: $872,364 - $1,062,000
4
Beds
2
Baths
1,316
Sq Ft
$716/Sq Ft
Est. Value
About This Home
This home is located at 119 N Windgap Dr, Orange, CA 92868 and is currently estimated at $942,591, approximately $716 per square foot. 119 N Windgap Dr is a home located in Orange County with nearby schools including Lampson Elementary School, Portola Middle School, and Orange High School.
Ownership History
Date
Name
Owned For
Owner Type
Purchase Details
Closed on
May 6, 2011
Sold by
Nicotra Joseph A
Bought by
Nicotra Joseph A and The Joseph A Nicotra Trust
Current Estimated Value
Purchase Details
Closed on
Feb 8, 2010
Sold by
Nicotra Helen A
Bought by
Nicotra Joseph A and Nicotra Helen A
Purchase Details
Closed on
Apr 22, 2002
Sold by
Nicotra Helen A
Bought by
Nicotra Helen A and Nicotra Family Trust
Create a Home Valuation Report for This Property
The Home Valuation Report is an in-depth analysis detailing your home's value as well as a comparison with similar homes in the area
Home Values in the Area
Average Home Value in this Area
Purchase History
| Date | Buyer | Sale Price | Title Company |
|---|---|---|---|
| Nicotra Joseph A | -- | None Available | |
| Nicotra Joseph A | -- | None Available | |
| Nicotra Helen A | -- | -- |
Source: Public Records
Tax History
| Year | Tax Paid | Tax Assessment Tax Assessment Total Assessment is a certain percentage of the fair market value that is determined by local assessors to be the total taxable value of land and additions on the property. | Land | Improvement |
|---|---|---|---|---|
| 2025 | $1,172 | $82,403 | $37,495 | $44,908 |
| 2024 | $1,172 | $80,788 | $36,760 | $44,028 |
| 2023 | $1,141 | $79,204 | $36,039 | $43,165 |
| 2022 | $1,114 | $77,651 | $35,332 | $42,319 |
| 2021 | $1,086 | $76,129 | $34,639 | $41,490 |
| 2020 | $1,075 | $75,349 | $34,284 | $41,065 |
| 2019 | $1,064 | $73,872 | $33,612 | $40,260 |
| 2018 | $1,047 | $72,424 | $32,953 | $39,471 |
| 2017 | $1,011 | $71,004 | $32,306 | $38,698 |
| 2016 | $993 | $69,612 | $31,672 | $37,940 |
| 2015 | $977 | $68,567 | $31,196 | $37,371 |
| 2014 | $955 | $67,224 | $30,585 | $36,639 |
Source: Public Records
Map
Nearby Homes
- 2300 S Lewis St Unit 143
- 2300 S Lewis St Unit 66
- 2300 Lewis Stree St
- 951 E Twill Ct
- 4418 W Tiller Ave
- 4512 W Sirius Ave
- 4524 W Sirius Ave
- 300 N Rampart St Unit 157
- 300 N Rampart St Unit 152
- 300 N Rampart St Unit 79
- 300 N Rampart St Unit 127
- 300 N Rampart St Unit space 158
- 222 Lampson Ave
- 12621 Spinnaker St
- 12560 Haster St Unit 207
- 3435 - 3437 W Park Balboa Ave
- 302 E Wakefield Ave
- 3607 W Park Central Ave Unit 2404
- 223 W Simmons Ave
- 3440 W Park Balboa Ave
- 111 N Windgap Dr
- 131 N Windgap Dr
- 3832 W Sherringham Ave
- 3818 W Sherringham Ave
- 120 N Windgap Dr
- 3827 W Chapman Ave
- 108 N Windgap Dr
- 130 N Windgap Dr
- 3845 W Sherringham Ave
- 138 N Windgap Dr
- 3829 W Sherringham Ave
- 118 N Woodridge Cir
- 110 N Woodridge Cir
- 148 N Windgap Dr
- 128 N Woodridge Cir
- 138 N Woodridge Cir
- 3815 W Sherringham Ave
- 121 N Sunningdale Cir
- 3844 W Compton Ave
- 131 N Sunningdale Cir
Your Personal Tour Guide
Ask me questions while you tour the home.