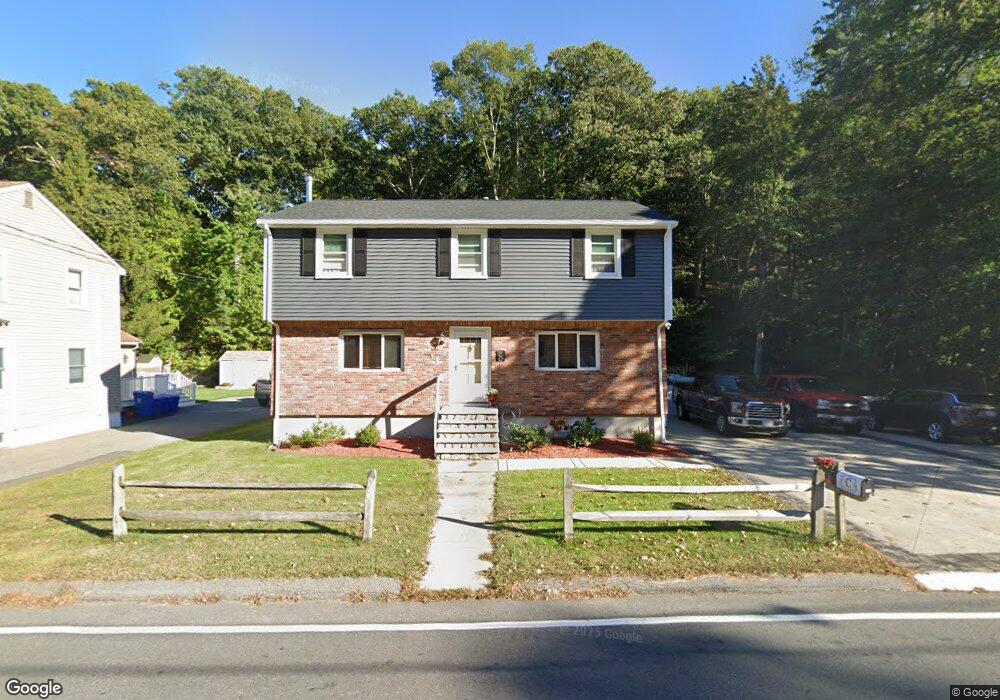
119 Oak St Wakefield, MA 01880
Woodville NeighborhoodEstimated Value: $790,000 - $838,000
4
Beds
2
Baths
1,800
Sq Ft
$457/Sq Ft
Est. Value
About This Home
This home is located at 119 Oak St, Wakefield, MA 01880 and is currently estimated at $821,751, approximately $456 per square foot. 119 Oak St is a home located in Middlesex County with nearby schools including Wakefield Memorial High School, St Joseph School, and St. Patrick Elementary School.
Ownership History
Date
Name
Owned For
Owner Type
Purchase Details
Closed on
Sep 13, 2023
Sold by
Crocker John D and Crocker Karen
Bought by
Crocker Ft and Crocker
Current Estimated Value
Purchase Details
Closed on
Sep 5, 1984
Bought by
Crocker John and Crocker Karen
Create a Home Valuation Report for This Property
The Home Valuation Report is an in-depth analysis detailing your home's value as well as a comparison with similar homes in the area
Home Values in the Area
Average Home Value in this Area
Purchase History
| Date | Buyer | Sale Price | Title Company |
|---|---|---|---|
| Crocker Ft | -- | None Available | |
| Crocker John | $59,000 | -- |
Source: Public Records
Mortgage History
| Date | Status | Borrower | Loan Amount |
|---|---|---|---|
| Previous Owner | Crocker John | $86,000 | |
| Previous Owner | Crocker John | $16,000 | |
| Previous Owner | Crocker John | $16,000 |
Source: Public Records
Tax History
| Year | Tax Paid | Tax Assessment Tax Assessment Total Assessment is a certain percentage of the fair market value that is determined by local assessors to be the total taxable value of land and additions on the property. | Land | Improvement |
|---|---|---|---|---|
| 2025 | $7,999 | $704,800 | $347,900 | $356,900 |
| 2024 | $7,561 | $672,100 | $331,500 | $340,600 |
| 2023 | $7,582 | $646,400 | $318,600 | $327,800 |
| 2022 | $7,318 | $594,000 | $292,300 | $301,700 |
| 2021 | $6,920 | $543,600 | $252,600 | $291,000 |
| 2020 | $6,598 | $516,700 | $240,100 | $276,600 |
| 2019 | $6,401 | $498,900 | $231,800 | $267,100 |
| 2018 | $6,168 | $476,300 | $221,300 | $255,000 |
| 2017 | $5,854 | $449,300 | $208,800 | $240,500 |
| 2016 | $5,314 | $393,900 | $184,600 | $209,300 |
| 2015 | $5,209 | $386,400 | $181,000 | $205,400 |
| 2014 | $4,845 | $379,100 | $177,500 | $201,600 |
Source: Public Records
Map
Nearby Homes
- 0 Everett St
- 1 Sidney St
- 34 Stark Ave
- 824 Main St Unit 1
- 61 Nahant St
- 62 Golden Hills Rd
- 21 Herbert St Unit A
- 1 Traverse St Unit E
- 15 Belmont Rd
- 35 Richardson St Unit 2
- 9 Lovis Ave
- 7 West St
- 350 Water St
- 12 Lovis Ave
- 9 Cyrus St
- 176 Bay State Rd
- 24 Mount Zion Rd
- 10 Wakefield Ave Unit B
- 11 Ludlow Ave
- 38 Morgan Ave
Your Personal Tour Guide
Ask me questions while you tour the home.