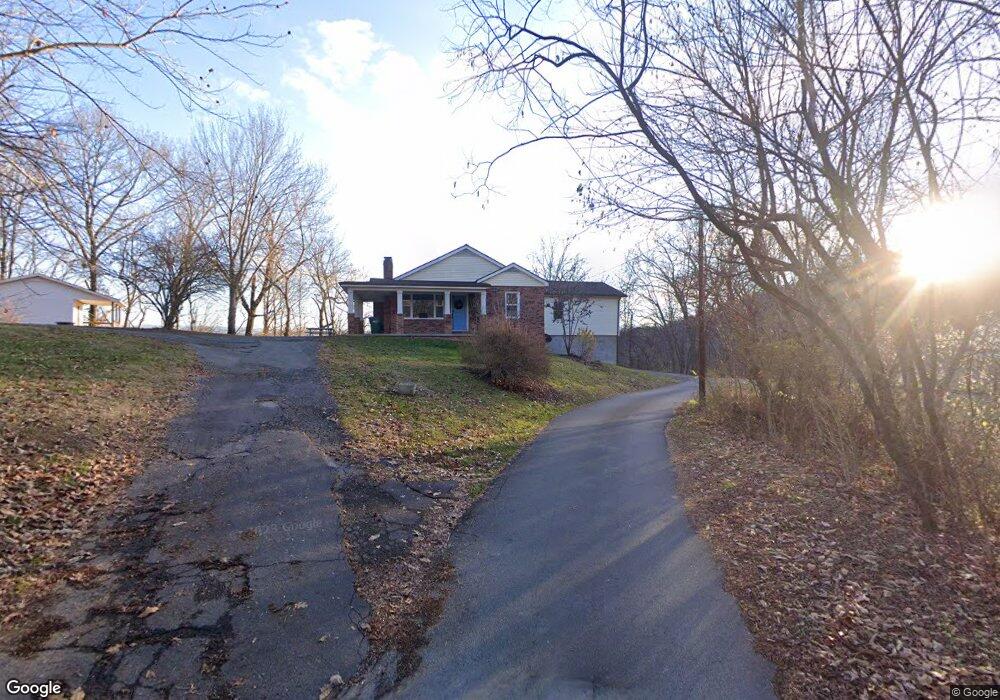
119 S 9th St Watauga, TN 37694
Estimated Value: $255,985 - $344,000
--
Bed
1
Bath
2,336
Sq Ft
$131/Sq Ft
Est. Value
About This Home
This home is located at 119 S 9th St, Watauga, TN 37694 and is currently estimated at $306,996, approximately $131 per square foot. 119 S 9th St is a home located in Carter County with nearby schools including St. Mary's School.
Ownership History
Date
Name
Owned For
Owner Type
Purchase Details
Closed on
Jul 18, 2019
Sold by
Ledges Llc
Bought by
Leda Holdings Llc
Current Estimated Value
Home Financials for this Owner
Home Financials are based on the most recent Mortgage that was taken out on this home.
Original Mortgage
$95,000
Outstanding Balance
$83,228
Interest Rate
3.82%
Mortgage Type
Future Advance Clause Open End Mortgage
Estimated Equity
$223,768
Purchase Details
Closed on
Jul 15, 2019
Sold by
Puckett Doyle
Bought by
The Ledges Llc
Home Financials for this Owner
Home Financials are based on the most recent Mortgage that was taken out on this home.
Original Mortgage
$95,000
Outstanding Balance
$83,228
Interest Rate
3.82%
Mortgage Type
Future Advance Clause Open End Mortgage
Estimated Equity
$223,768
Purchase Details
Closed on
Sep 8, 2006
Sold by
Puckett Doyle
Bought by
Ledges Llc The
Purchase Details
Closed on
Aug 31, 2006
Bought by
The Ledges Llc
Purchase Details
Closed on
Oct 16, 1995
Bought by
Puckett Doyle L and Puckett Wilma
Purchase Details
Closed on
Jan 10, 1990
Bought by
Puckett Doyle L and Puckett Wilma
Purchase Details
Closed on
Jul 23, 1984
Bought by
Puckett Doyle
Create a Home Valuation Report for This Property
The Home Valuation Report is an in-depth analysis detailing your home's value as well as a comparison with similar homes in the area
Home Values in the Area
Average Home Value in this Area
Purchase History
| Date | Buyer | Sale Price | Title Company |
|---|---|---|---|
| Leda Holdings Llc | $195,000 | None Available | |
| The Ledges Llc | -- | None Available | |
| Ledges Llc The | $145,000 | -- | |
| The Ledges Llc | $145,100 | -- | |
| Puckett Doyle L | $600 | -- | |
| Puckett Doyle L | -- | -- | |
| Puckett Doyle | -- | -- |
Source: Public Records
Mortgage History
| Date | Status | Borrower | Loan Amount |
|---|---|---|---|
| Open | Leda Holdings Llc | $95,000 |
Source: Public Records
Tax History Compared to Growth
Tax History
| Year | Tax Paid | Tax Assessment Tax Assessment Total Assessment is a certain percentage of the fair market value that is determined by local assessors to be the total taxable value of land and additions on the property. | Land | Improvement |
|---|---|---|---|---|
| 2024 | $2,248 | $51,550 | $8,650 | $42,900 |
| 2023 | $2,248 | $51,550 | $0 | $0 |
| 2022 | $1,340 | $51,550 | $8,650 | $42,900 |
| 2021 | $1,046 | $51,550 | $8,650 | $42,900 |
| 2020 | $1,240 | $51,550 | $8,650 | $42,900 |
| 2019 | $1,037 | $39,100 | $7,675 | $31,425 |
| 2018 | $1,037 | $32,725 | $2,250 | $30,475 |
| 2017 | $1,037 | $32,725 | $2,250 | $30,475 |
| 2016 | $917 | $32,725 | $2,250 | $30,475 |
| 2015 | $916 | $32,725 | $2,250 | $30,475 |
| 2014 | $958 | $34,200 | $2,250 | $31,950 |
Source: Public Records
Map
Nearby Homes
- 373 Dalewood Rd
- 219 N 4th St
- 107 S 2nd St
- 198 Maple Tree Ln
- 115 Towneview Estates Dr
- 250 Riggs Rd
- 918 Riverview Dr
- 149 Meredith Valley Ln Unit A
- 149 Meredith Valley Ln
- 2856 Watauga Rd
- 244 Sinking Creek Rd
- 126 Hughes St
- 955 Sycamore Shoals Dr
- 176 Wade Bulla Rd
- 143 Carr Cemetery Rd
- 190 Hilton Hill Rd
- 1906 W G St
- 2026 W G St
- Hillside Hillside Dr
- 373 Old Watauga Rd