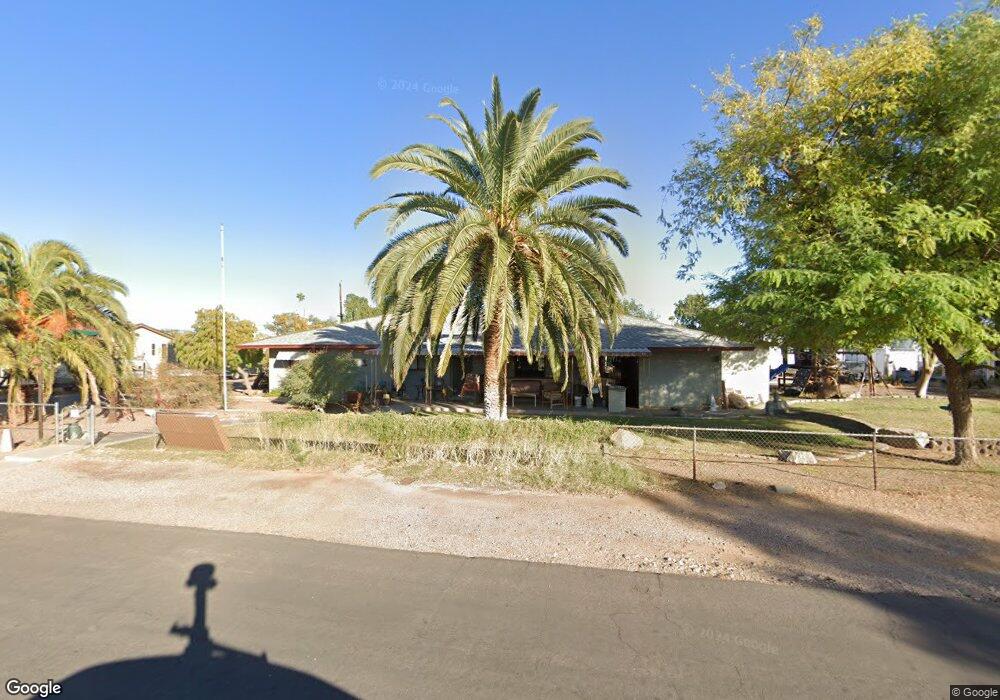
119 S Emerald Dr Apache Junction, AZ 85120
Northeast Mesa NeighborhoodEstimated Value: $362,000 - $587,000
Studio
2
Baths
2,717
Sq Ft
$177/Sq Ft
Est. Value
About This Home
This home is located at 119 S Emerald Dr, Apache Junction, AZ 85120 and is currently estimated at $479,898, approximately $176 per square foot. 119 S Emerald Dr is a home located in Maricopa County with nearby schools including Brinton Elementary School, Franklin at Brimhall Elementary School, and Franklin West Elementary School.
Ownership History
Date
Name
Owned For
Owner Type
Purchase Details
Closed on
Jun 2, 2000
Sold by
Hud
Bought by
Garrison James M and Garrison Ronda M
Current Estimated Value
Home Financials for this Owner
Home Financials are based on the most recent Mortgage that was taken out on this home.
Original Mortgage
$115,254
Outstanding Balance
$41,933
Interest Rate
8.67%
Mortgage Type
FHA
Estimated Equity
$437,965
Purchase Details
Closed on
Mar 3, 2000
Sold by
Principal Residential Mtg Inc
Bought by
Hud
Purchase Details
Closed on
Jul 2, 1999
Sold by
Rymkey Michael R and Rymkey Denise L
Bought by
Principal Residential Mtg Inc
Purchase Details
Closed on
Jun 21, 1996
Sold by
James Garland P and James Mary R
Bought by
Rymkey Michael R and Rymkey Denise L
Home Financials for this Owner
Home Financials are based on the most recent Mortgage that was taken out on this home.
Original Mortgage
$88,344
Interest Rate
8.01%
Mortgage Type
FHA
Create a Home Valuation Report for This Property
The Home Valuation Report is an in-depth analysis detailing your home's value as well as a comparison with similar homes in the area
Home Values in the Area
Average Home Value in this Area
Purchase History
| Date | Buyer | Sale Price | Title Company |
|---|---|---|---|
| Garrison James M | -- | First Southwestern Title | |
| Hud | -- | First American Title | |
| Principal Residential Mtg Inc | $100,134 | Security Title Agency | |
| Rymkey Michael R | $89,000 | First American Title |
Source: Public Records
Mortgage History
| Date | Status | Borrower | Loan Amount |
|---|---|---|---|
| Open | Garrison James M | $115,254 | |
| Previous Owner | Rymkey Michael R | $88,344 |
Source: Public Records
Tax History
| Year | Tax Paid | Tax Assessment Tax Assessment Total Assessment is a certain percentage of the fair market value that is determined by local assessors to be the total taxable value of land and additions on the property. | Land | Improvement |
|---|---|---|---|---|
| 2025 | $1,901 | $21,102 | -- | -- |
| 2024 | $1,924 | $20,097 | -- | -- |
| 2023 | $1,924 | $41,830 | $8,360 | $33,470 |
| 2022 | $1,878 | $30,120 | $6,020 | $24,100 |
| 2021 | $1,873 | $25,530 | $5,100 | $20,430 |
| 2020 | $997 | $16,600 | $3,320 | $13,280 |
| 2019 | $924 | $15,860 | $3,170 | $12,690 |
| 2018 | $901 | $14,570 | $2,910 | $11,660 |
| 2017 | $870 | $13,000 | $2,600 | $10,400 |
| 2016 | $852 | $12,280 | $2,450 | $9,830 |
| 2015 | $796 | $10,080 | $2,010 | $8,070 |
Source: Public Records
Map
Nearby Homes
- 724 S Emerald Dr
- 744 S Emerald Dr
- 11529 E 4th Ave
- 11435 E Apache Trail Unit 48
- 11435 E Apache Trail Unit 84
- 301 S Elmont Dr
- 143 S Mountain Rd
- 11311 E 6th Ave
- 11451 E Broadway Rd
- 434 S 113th Way
- 53 N Mountain Rd Unit 75
- 351 N Meridian Rd Unit 2
- 351 N Meridian Rd Unit 101
- 351 N Meridian Rd Unit 122
- 351 N Meridian Rd Unit 9
- 11066 E Abilene Ave
- 11100 E Apache Trail Unit 37
- 11100 E Apache Trail
- 11100 E Apache Trail Unit 8
- 11100 E Apache Trail Unit 16
- 112 S Emerald Dr
- 136 S Emerald Dr
- 104 S Emerald Dr
- 11430 E 4th Ave
- 11422 E 4th Ave
- 135 S Rex Ave
- 141 S Rex Ave
- 125 S Rex Ave
- 109 S Rex Ave
- 147 S Rex Ave
- 153 S Rex Ave
- 11421 E 4th Ave
- 11415 E 4th Ave
- 133 S Rex Ave
- 11427 E 4th Ave
- 134 S Rex Ave
- 128 S Rex Ave
- 11393 E 4th Ave
- 11435 E 4th Ave
- 124 S Rex Ave
Your Personal Tour Guide
Ask me questions while you tour the home.