Estimated Value: $480,000 - $628,000
--
Bed
2
Baths
2,046
Sq Ft
$261/Sq Ft
Est. Value
About This Home
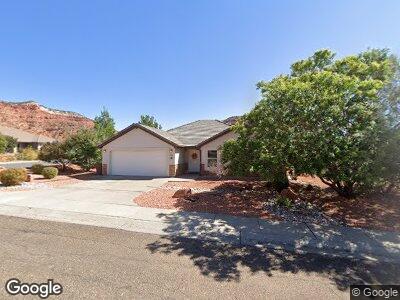
This home is located at 119 S Putter Ln, Kanab, UT 84741 and is currently estimated at $534,504, approximately $261 per square foot. 119 S Putter Ln is a home located in Kane County with nearby schools including Kanab Elementary School, Kanab Middle School, and Kanab High School.
Ownership History
Date
Name
Owned For
Owner Type
Purchase Details
Closed on
May 9, 2023
Sold by
Cooper Victor K
Bought by
Eyetomic Llc
Current Estimated Value
Purchase Details
Closed on
Jul 9, 2014
Sold by
Victoria C Victoria C
Bought by
Cooper Victor K
Purchase Details
Closed on
Jun 29, 2010
Sold by
Federal National Mortgage Association
Bought by
Cooper Victor K and Cooper Victoria C
Purchase Details
Closed on
Dec 7, 2009
Sold by
Recontrust Company Na
Bought by
Federal National Mortgage Association
Purchase Details
Closed on
Jan 26, 2009
Sold by
Mers
Bought by
Recontrust Company Na
Purchase Details
Closed on
Apr 3, 2007
Sold by
Pensco Trust Co-Custodian
Bought by
Coons Thor N and Coons Heather J
Home Financials for this Owner
Home Financials are based on the most recent Mortgage that was taken out on this home.
Original Mortgage
$208,000
Interest Rate
6.29%
Purchase Details
Closed on
Sep 28, 2005
Sold by
Golden Circle Tours Inc
Bought by
Pensco Trust Company - Custodian and Valerie D Spackman Ira Sp1y Fbo
Create a Home Valuation Report for This Property
The Home Valuation Report is an in-depth analysis detailing your home's value as well as a comparison with similar homes in the area
Home Values in the Area
Average Home Value in this Area
Purchase History
| Date | Buyer | Sale Price | Title Company |
|---|---|---|---|
| Eyetomic Llc | -- | -- | |
| Cooper Victor K | -- | -- | |
| Cooper Victor K | -- | -- | |
| Federal National Mortgage Association | -- | -- | |
| Recontrust Company Na | -- | -- | |
| Coons Thor N | -- | -- | |
| Pensco Trust Company - Custodian | -- | -- |
Source: Public Records
Mortgage History
| Date | Status | Borrower | Loan Amount |
|---|---|---|---|
| Previous Owner | Cooper Victor K | $720,000 | |
| Previous Owner | Coons Thor N | $263,200 | |
| Previous Owner | Coons Thor N | $208,000 |
Source: Public Records
Tax History Compared to Growth
Tax History
| Year | Tax Paid | Tax Assessment Tax Assessment Total Assessment is a certain percentage of the fair market value that is determined by local assessors to be the total taxable value of land and additions on the property. | Land | Improvement |
|---|---|---|---|---|
| 2024 | $2,370 | $275,377 | $54,916 | $220,461 |
| 2023 | $3,921 | $256,776 | $52,531 | $204,245 |
| 2022 | $3,386 | $219,568 | $33,891 | $185,677 |
| 2021 | $3,057 | $297,470 | $47,400 | $250,070 |
| 2020 | $3,004 | $283,823 | $47,400 | $236,423 |
| 2019 | $1,806 | $302,140 | $54,912 | $247,228 |
| 2018 | $1,767 | $292,988 | $45,760 | $247,228 |
| 2017 | $1,681 | $266,223 | $41,600 | $224,623 |
| 2016 | $1,489 | $228,948 | $41,600 | $187,348 |
| 2015 | $1,122 | $211,969 | $41,600 | $170,369 |
| 2014 | $1,122 | $171,692 | $49,735 | $121,957 |
| 2013 | -- | $94,430 | $0 | $0 |
Source: Public Records
Map
Nearby Homes
- 786 Cedar Cir
- 655 S Hillside Dr
- 512 E Chuckwagon Cir
- 444 Ladera Ln
- 484 E Mohawk Dr
- 326 E 150 S
- 1117 S Terrel Dr
- 533 E Cutter Trail
- 410 W Los Barancos Ln
- 300 E 300 N Unit L5
- 931 S Hillside Dr
- 818 S Highway 89a
- 163 E 200 N
- 246 N 150 E
- 325 S Main St
- 89 W 100 S
- 67 W 300 S
- 75 N 200 W
- 197 N 200 W
- 64 E Sedona Valley Rd