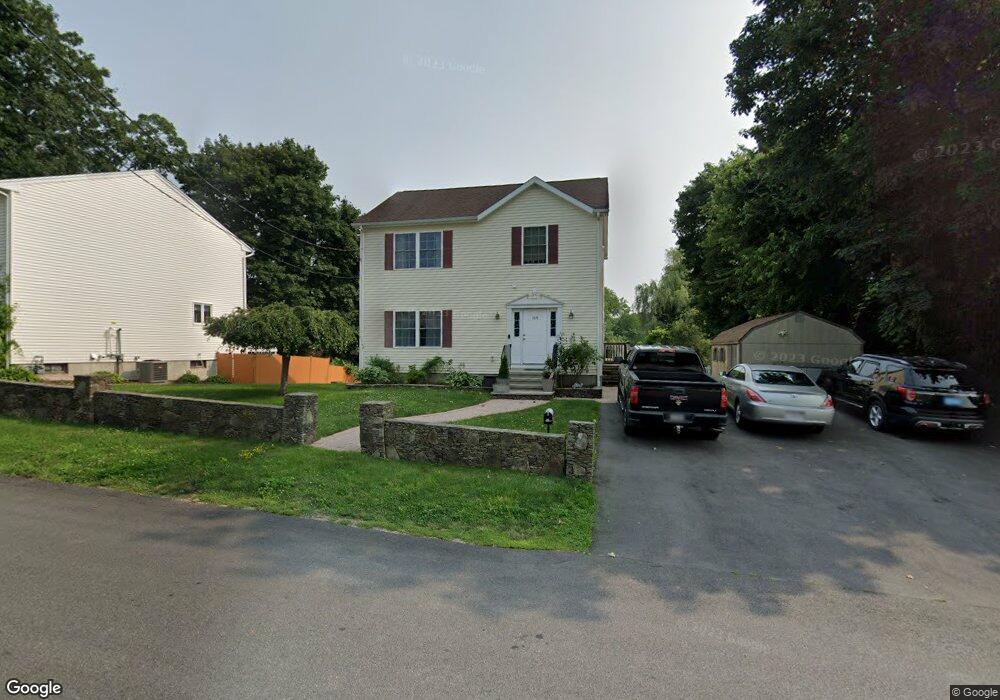
119 Slade St Fall River, MA 02724
Sandy Beach NeighborhoodEstimated Value: $432,000 - $538,000
3
Beds
2
Baths
1,680
Sq Ft
$277/Sq Ft
Est. Value
About This Home
This home is located at 119 Slade St, Fall River, MA 02724 and is currently estimated at $465,161, approximately $276 per square foot. 119 Slade St is a home located in Bristol County with nearby schools including Carlton M. Viveiros Elementary School, Matthew J. Kuss Middle School, and B M C Durfee High School.
Ownership History
Date
Name
Owned For
Owner Type
Purchase Details
Closed on
Dec 14, 2023
Sold by
Barbosa Jose M and Barbosa Claudia
Bought by
Barbosa Jose M and Barbosa Maria D
Current Estimated Value
Home Financials for this Owner
Home Financials are based on the most recent Mortgage that was taken out on this home.
Original Mortgage
$339,500
Outstanding Balance
$331,476
Interest Rate
6.13%
Mortgage Type
Adjustable Rate Mortgage/ARM
Estimated Equity
$133,685
Purchase Details
Closed on
Mar 1, 2006
Sold by
Barbosa Claudia and Barbosa Jose M
Bought by
East Coast Homes Llc
Create a Home Valuation Report for This Property
The Home Valuation Report is an in-depth analysis detailing your home's value as well as a comparison with similar homes in the area
Home Values in the Area
Average Home Value in this Area
Purchase History
| Date | Buyer | Sale Price | Title Company |
|---|---|---|---|
| Barbosa Jose M | -- | None Available | |
| Barbosa Jose M | -- | None Available | |
| Barbosa Jose M | -- | None Available | |
| East Coast Homes Llc | $209,000 | -- | |
| East Coast Homes Llc | $209,000 | -- |
Source: Public Records
Mortgage History
| Date | Status | Borrower | Loan Amount |
|---|---|---|---|
| Open | Barbosa Jose M | $339,500 | |
| Closed | Barbosa Jose M | $339,500 |
Source: Public Records
Tax History
| Year | Tax Paid | Tax Assessment Tax Assessment Total Assessment is a certain percentage of the fair market value that is determined by local assessors to be the total taxable value of land and additions on the property. | Land | Improvement |
|---|---|---|---|---|
| 2025 | $4,123 | $360,100 | $109,000 | $251,100 |
| 2024 | $3,851 | $335,200 | $105,000 | $230,200 |
| 2023 | $3,876 | $315,900 | $86,800 | $229,100 |
| 2022 | $3,445 | $273,000 | $82,600 | $190,400 |
| 2021 | $3,377 | $244,200 | $78,600 | $165,600 |
| 2020 | $3,360 | $232,500 | $77,500 | $155,000 |
| 2019 | $3,248 | $222,800 | $74,600 | $148,200 |
| 2018 | $3,218 | $220,100 | $80,800 | $139,300 |
| 2017 | $2,995 | $213,900 | $77,000 | $136,900 |
| 2016 | $2,872 | $210,700 | $81,900 | $128,800 |
| 2015 | $2,778 | $212,400 | $81,900 | $130,500 |
| 2014 | $2,642 | $210,000 | $79,500 | $130,500 |
Source: Public Records
Map
Nearby Homes
- 245 Dwelly St
- 464 Birch St
- 609 King Philip St
- 20 Wilcox St
- 1852 S Main St
- 1846 S Main St
- 24 Valley St
- 616 Woodman St
- 15 Higgins St
- 57 Larouche St
- 126 Wheeler St
- 2229 S Main St
- 234 Kilburn St
- 1334 S Main St
- 917 Dwelly St
- 1273-1279 S Main St
- 70 Brown St
- 344-354 E Main St
- 579 Summit St Unit 3
- 579 Summit St Unit 2
Your Personal Tour Guide
Ask me questions while you tour the home.