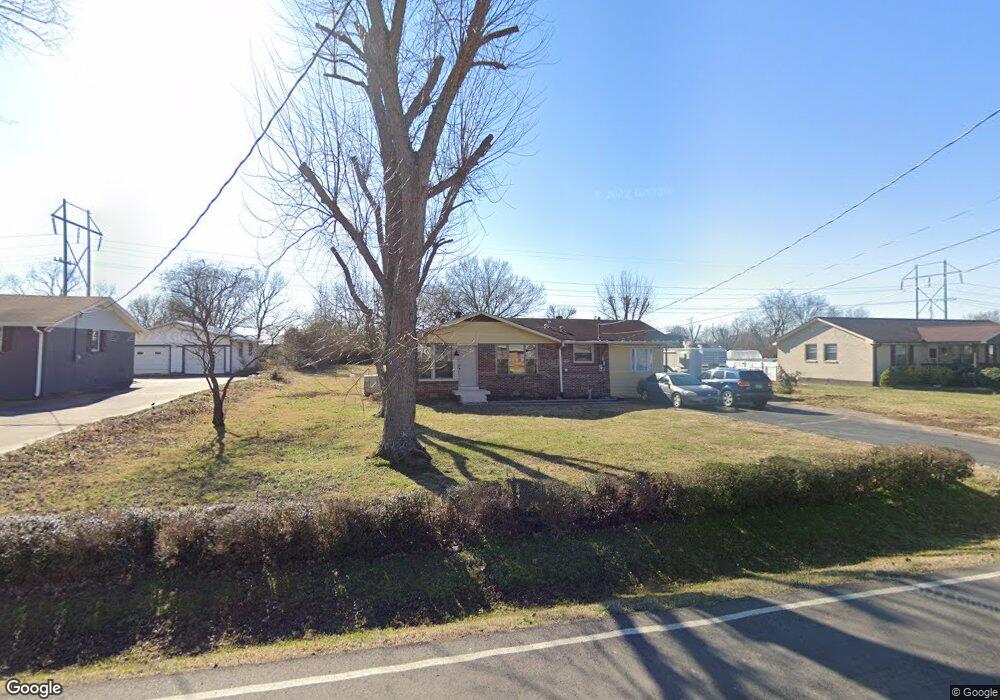
119 Steve Roberts Dr Smyrna, TN 37167
Estimated Value: $296,011 - $367,000
--
Bed
2
Baths
1,629
Sq Ft
$210/Sq Ft
Est. Value
About This Home
This home is located at 119 Steve Roberts Dr, Smyrna, TN 37167 and is currently estimated at $342,253, approximately $210 per square foot. 119 Steve Roberts Dr is a home located in Rutherford County with nearby schools including Smyrna Primary School, Smyrna Middle School, and Smyrna High School.
Ownership History
Date
Name
Owned For
Owner Type
Purchase Details
Closed on
Mar 20, 2024
Sold by
Pearce Melody R
Bought by
Villalobos Alberto Gabriel and Villalobos Melody R
Current Estimated Value
Home Financials for this Owner
Home Financials are based on the most recent Mortgage that was taken out on this home.
Original Mortgage
$60,000
Outstanding Balance
$53,327
Interest Rate
6.64%
Mortgage Type
Credit Line Revolving
Estimated Equity
$288,926
Purchase Details
Closed on
May 31, 2006
Sold by
Spry Elmer W and Spry Alva L
Bought by
Pearce Melody R
Home Financials for this Owner
Home Financials are based on the most recent Mortgage that was taken out on this home.
Original Mortgage
$82,671
Interest Rate
6.51%
Mortgage Type
Purchase Money Mortgage
Purchase Details
Closed on
Oct 4, 2005
Sold by
Spry Elmer W
Bought by
Spry Elmer W and Spry Alva L
Purchase Details
Closed on
May 12, 1994
Sold by
Arnold Perkins Bradley
Bought by
Spry Elmer W
Create a Home Valuation Report for This Property
The Home Valuation Report is an in-depth analysis detailing your home's value as well as a comparison with similar homes in the area
Home Values in the Area
Average Home Value in this Area
Purchase History
| Date | Buyer | Sale Price | Title Company |
|---|---|---|---|
| Villalobos Alberto Gabriel | -- | Foundation Title | |
| Pearce Melody R | $84,000 | -- | |
| Pearce Melody R | $84,000 | -- | |
| Spry Elmer W | -- | -- | |
| Spry Elmer W | -- | -- |
Source: Public Records
Mortgage History
| Date | Status | Borrower | Loan Amount |
|---|---|---|---|
| Open | Villalobos Alberto Gabriel | $60,000 | |
| Previous Owner | Pearce Melody R | $82,671 |
Source: Public Records
Tax History Compared to Growth
Tax History
| Year | Tax Paid | Tax Assessment Tax Assessment Total Assessment is a certain percentage of the fair market value that is determined by local assessors to be the total taxable value of land and additions on the property. | Land | Improvement |
|---|---|---|---|---|
| 2025 | $1,452 | $60,425 | $13,750 | $46,675 |
| 2024 | $1,452 | $60,425 | $13,750 | $46,675 |
| 2023 | $1,452 | $60,425 | $13,750 | $46,675 |
| 2022 | $1,295 | $60,425 | $13,750 | $46,675 |
| 2021 | $1,237 | $42,350 | $8,750 | $33,600 |
| 2020 | $1,237 | $42,350 | $8,750 | $33,600 |
| 2019 | $1,237 | $42,350 | $8,750 | $33,600 |
| 2018 | $1,186 | $42,350 | $0 | $0 |
| 2017 | $1,168 | $32,750 | $0 | $0 |
| 2016 | $1,168 | $32,750 | $0 | $0 |
| 2015 | $1,168 | $32,750 | $0 | $0 |
| 2014 | $814 | $32,750 | $0 | $0 |
| 2013 | -- | $23,600 | $0 | $0 |
Source: Public Records
Map
Nearby Homes
- 1547 Repton Rd
- 108 McNickle Dr
- 3011 Denny Brooke Ln
- 0 Walnut St
- 3040 Denny Brooke Ln
- 107 Oak Valley Cir
- 119 Tedder Blvd
- 104 Belaire Dr
- 203 McNickle Dr
- 131 Tedder Blvd
- 148 Tedder Blvd
- 201 Bane Dr
- 120 Ace Ave
- 130 Ace Ave
- 140 Ace Ave
- 110 Ace Ave
- 1307 Talia Trace Plan at Talia Trace
- 1781-3 Talia Trace Town Home Plan at Talia Trace
- 1723-2 Talia Trace Town Home Plan at Talia Trace
- 1306 Talia Trace Plan at Talia Trace
- 117 Steve Roberts Dr
- 121 Steve Roberts Dr
- 114 Hankins Dr
- 115 Steve Roberts Dr
- 123 Steve Roberts Dr
- 112 Hankins Dr
- 116 Hankins Dr
- 118 Steve Roberts Dr
- 116 Steve Roberts Dr
- 118 Hankins Dr
- 110 Hankins Dr
- 120 Steve Roberts Dr
- 114 Steve Roberts Dr
- 113 Steve Roberts Dr
- 125 Steve Roberts Dr
- 122 Steve Roberts Dr
- 112 Steve Roberts Dr
- 216 W Hutchinson Dr
- 108 Hankins Dr
- 111 Hankins Dr