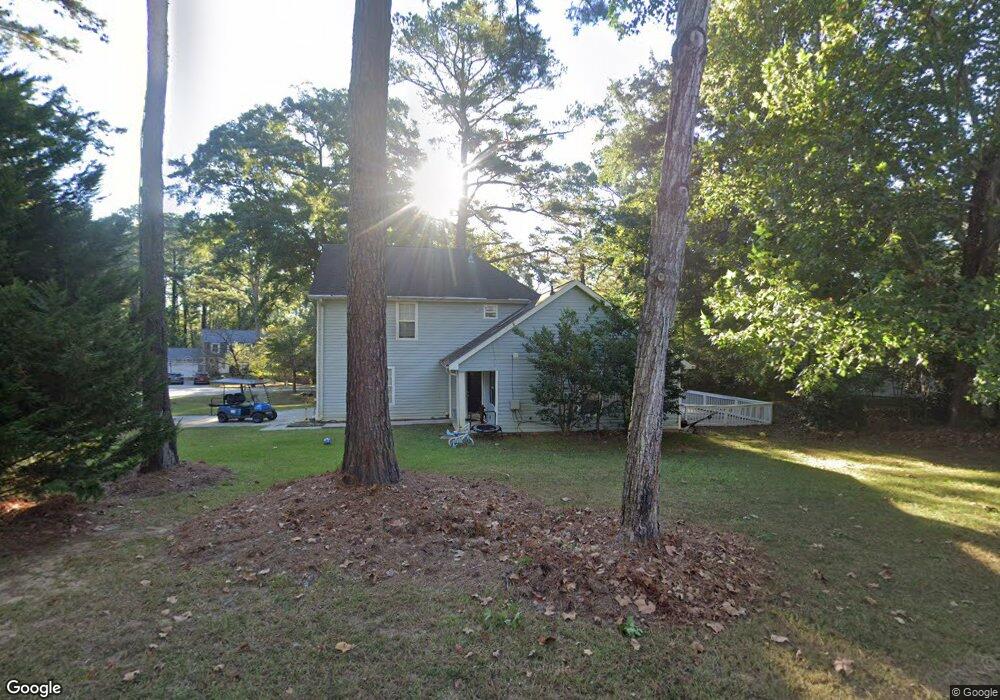
119 Sweetgum Rd Peachtree City, GA 30269
Estimated Value: $301,000 - $341,000
3
Beds
2
Baths
1,419
Sq Ft
$231/Sq Ft
Est. Value
About This Home
This home is located at 119 Sweetgum Rd, Peachtree City, GA 30269 and is currently estimated at $328,024, approximately $231 per square foot. 119 Sweetgum Rd is a home located in Fayette County with nearby schools including Oak Grove Elementary School, Rising Starr Middle School, and Starrs Mill High School.
Ownership History
Date
Name
Owned For
Owner Type
Purchase Details
Closed on
Oct 24, 2008
Sold by
Federal Natl Mtg Assn Fnma
Bought by
Qin Lixin and Chen Wenli
Current Estimated Value
Home Financials for this Owner
Home Financials are based on the most recent Mortgage that was taken out on this home.
Original Mortgage
$84,750
Interest Rate
5.89%
Mortgage Type
New Conventional
Purchase Details
Closed on
Apr 1, 2008
Sold by
Indymac Bank Fsb
Bought by
Federal National Mortgage Association
Purchase Details
Closed on
Jan 12, 2006
Sold by
Brett Vincent Properties Inc
Bought by
Vincent Brett
Purchase Details
Closed on
Sep 24, 2003
Sold by
Vincent Brett D
Bought by
Brett Vincent Properties Inc
Purchase Details
Closed on
Dec 3, 1998
Sold by
Kan Charistina K
Bought by
Vincent Brett
Home Financials for this Owner
Home Financials are based on the most recent Mortgage that was taken out on this home.
Original Mortgage
$74,550
Interest Rate
6.84%
Mortgage Type
New Conventional
Create a Home Valuation Report for This Property
The Home Valuation Report is an in-depth analysis detailing your home's value as well as a comparison with similar homes in the area
Home Values in the Area
Average Home Value in this Area
Purchase History
| Date | Buyer | Sale Price | Title Company |
|---|---|---|---|
| Qin Lixin | -- | -- | |
| Federal National Mortgage Association | -- | -- | |
| Indmac Bank Fsb | $135,208 | -- | |
| Vincent Brett | -- | -- | |
| Brett Vincent Properties Inc | -- | -- | |
| Vincent Brett | $78,500 | -- |
Source: Public Records
Mortgage History
| Date | Status | Borrower | Loan Amount |
|---|---|---|---|
| Closed | Qin Lixin | $84,750 | |
| Previous Owner | Vincent Brett | $74,550 |
Source: Public Records
Tax History Compared to Growth
Tax History
| Year | Tax Paid | Tax Assessment Tax Assessment Total Assessment is a certain percentage of the fair market value that is determined by local assessors to be the total taxable value of land and additions on the property. | Land | Improvement |
|---|---|---|---|---|
| 2024 | $3,480 | $117,756 | $22,000 | $95,756 |
| 2023 | $3,433 | $113,160 | $22,000 | $91,160 |
| 2022 | $2,979 | $98,360 | $22,000 | $76,360 |
| 2021 | $2,647 | $86,160 | $22,000 | $64,160 |
| 2020 | $2,505 | $80,680 | $15,200 | $65,480 |
| 2019 | $2,373 | $75,680 | $15,200 | $60,480 |
| 2018 | $2,220 | $69,680 | $15,200 | $54,480 |
| 2017 | $2,201 | $80,720 | $15,200 | $65,520 |
| 2016 | $2,338 | $70,240 | $15,200 | $55,040 |
| 2015 | $2,211 | $65,320 | $15,200 | $50,120 |
| 2014 | $2,037 | $59,120 | $15,200 | $43,920 |
| 2013 | -- | $57,440 | $0 | $0 |
Source: Public Records
Map
Nearby Homes
- 124 Hickory Dr
- 709 Cove Rd
- 4 & 5 Northlake Cir
- 101 Bluegill Trace
- 213 Cedar Dr
- 401 Peachtree Club Dr
- 104 Ridgefield Dr
- 102 Spincast Ct
- 107 Presidio Park
- 228 Terrane Ridge
- 105 Highgreen Ridge
- 2006 Village Park Dr
- 244 Terrane Ridge
- 217 Hilltop Dr
- 514 Clearwater Cove
- 445 Seabisuit Walk
- 300 Martingale Dr
- 319 Ruffian Cir Unit 71
- 313 Ruffian Cir Unit 74
- 317 Ruffian Cir Unit 72
- 102 Cypress Ct
- 121 Sweetgum Rd
- 117 Sweetgum Rd
- 118 Sweetgum Rd
- 120 Sweetgum Rd
- 104 Cypress Ct
- 123 Sweetgum Rd
- 116 Sweetgum Rd
- 122 Sweetgum Rd
- 124 Sweetgum Rd
- 103 Cypress Ct
- 105 Bluebell Ct
- 105 Cypress Ct
- 114 Sweetgum Rd
- 109 Butternut Ln
- 111 Butternut Ln
- 126 Sweetgum Rd
- 126 Sweetgum Rd Unit 31
- 125 Sweetgum Rd
- 102 Boxwood Ct