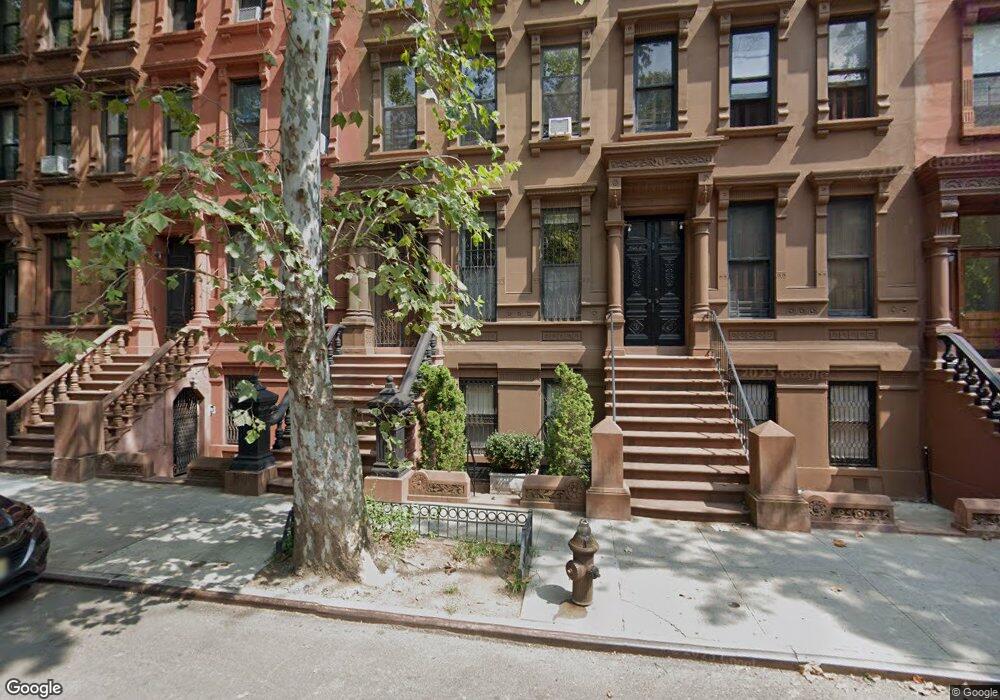
119 W 130th St New York, NY 10027
Central Harlem NeighborhoodEstimated Value: $1,974,000 - $3,293,000
--
Bed
--
Bath
3,888
Sq Ft
$679/Sq Ft
Est. Value
About This Home
This home is located at 119 W 130th St, New York, NY 10027 and is currently estimated at $2,640,667, approximately $679 per square foot. 119 W 130th St is a home located in New York County with nearby schools including P.S. 154 Harriet Tubman, Urban Assembly Academy for Future Leaders, and Democracy Prep Harlem Charter School.
Ownership History
Date
Name
Owned For
Owner Type
Purchase Details
Closed on
Dec 1, 2015
Sold by
Chase Myles and Leblanc Jeanne
Bought by
The Chase And Leblanc 2015 Family Trust and Myles Chase Trustee
Current Estimated Value
Purchase Details
Closed on
May 14, 2004
Sold by
Homeside Development Corp
Bought by
Chase Myles and Leblanc Jeanne
Home Financials for this Owner
Home Financials are based on the most recent Mortgage that was taken out on this home.
Original Mortgage
$498,000
Interest Rate
5.88%
Mortgage Type
Purchase Money Mortgage
Purchase Details
Closed on
Sep 25, 2003
Sold by
Glasgow Veronica
Bought by
Homeside Development Corp
Purchase Details
Closed on
Oct 6, 2001
Sold by
King Mark A
Bought by
Glasgow Veronica M
Purchase Details
Closed on
Feb 20, 1995
Sold by
Estein Joaquin Tirado
Bought by
King Mark A
Create a Home Valuation Report for This Property
The Home Valuation Report is an in-depth analysis detailing your home's value as well as a comparison with similar homes in the area
Home Values in the Area
Average Home Value in this Area
Purchase History
| Date | Buyer | Sale Price | Title Company |
|---|---|---|---|
| The Chase And Leblanc 2015 Family Trust | -- | -- | |
| Chase Myles | $675,500 | -- | |
| Chase Myles | $675,500 | -- | |
| Homeside Development Corp | $375,000 | -- | |
| Homeside Development Corp | $375,000 | -- | |
| Glasgow Veronica M | -- | -- | |
| Glasgow Veronica M | -- | -- | |
| King Mark A | -- | -- | |
| King Mark A | -- | -- |
Source: Public Records
Mortgage History
| Date | Status | Borrower | Loan Amount |
|---|---|---|---|
| Previous Owner | Chase Myles | $397,325 | |
| Previous Owner | Chase Myles | $498,000 |
Source: Public Records
Tax History Compared to Growth
Tax History
| Year | Tax Paid | Tax Assessment Tax Assessment Total Assessment is a certain percentage of the fair market value that is determined by local assessors to be the total taxable value of land and additions on the property. | Land | Improvement |
|---|---|---|---|---|
| 2025 | $11,328 | $59,780 | $12,308 | $47,472 |
| 2024 | $11,328 | $56,398 | $39,480 | $42,775 |
| 2023 | $10,806 | $53,206 | $14,278 | $38,928 |
| 2022 | $10,622 | $155,820 | $39,480 | $116,340 |
| 2021 | $11,113 | $158,040 | $39,480 | $118,560 |
| 2020 | $10,545 | $153,960 | $39,480 | $114,480 |
| 2019 | $9,832 | $139,140 | $39,480 | $99,660 |
| 2018 | $8,741 | $44,338 | $12,478 | $31,860 |
| 2017 | $8,739 | $44,338 | $12,553 | $31,785 |
| 2016 | $8,487 | $44,004 | $14,887 | $29,117 |
| 2015 | $4,825 | $41,514 | $21,059 | $20,455 |
| 2014 | $4,825 | $39,165 | $23,838 | $15,327 |
Source: Public Records
Map
Nearby Homes
- 145 W 129th St Unit 4
- 145 W 129th St Unit 1
- 145 W 129th St Unit 3
- 145 W 129th St Unit GARDEN
- 145 W 129th St Unit 2
- 124 W 131st St
- 108 W 131st St
- 106 W 131st St
- 168 W 130th St
- 129 W 131st St Unit 1
- 370 Lenox Ave Unit 609
- 370 Lenox Ave Unit 501
- 370 Lenox Ave Unit 401
- 370 Lenox Ave Unit PH1
- 370 Lenox Ave Unit 509
- 370 Lenox Ave Unit PH8
- 370 Lenox Ave Unit 406
- 370 Lenox Ave Unit 608
- 380 Lenox Ave
- 380 Lenox Ave Unit PHE
- 119 W 130th St Unit 3
- 119 W 130th St Unit 2
- 117 W 130th St
- 115 W 130th St
- 115 W 130th St Unit 3
- 115 W 130th St Unit 2
- 115 W 130th St Unit G
- 115 W 130th St Unit 1
- 121 W 130th St
- 123 W 130th St Unit 2
- 123 W 130th St
- 127 W 130th St
- 113 W 130th St
- 113 W 130th St Unit Garden
- 113 W 130th St Unit 3
- 113 W 130th St Unit 4
- 113 W 130th St Unit PARLOR
- 113 W 130th St Unit 2
- 113 W 130th St Unit FOUR
- 111 W 130th St Unit GARDEN