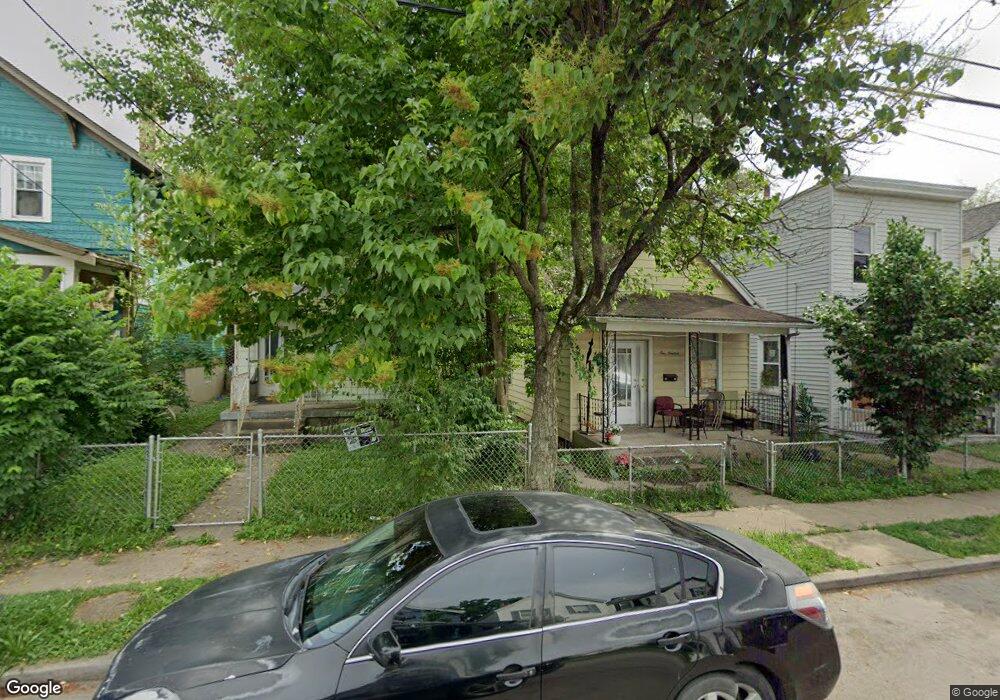
119 W 69th St Cincinnati, OH 45216
Carthage NeighborhoodEstimated Value: $107,886 - $421,000
2
Beds
1
Bath
956
Sq Ft
$201/Sq Ft
Est. Value
About This Home
This home is located at 119 W 69th St, Cincinnati, OH 45216 and is currently estimated at $192,222, approximately $201 per square foot. 119 W 69th St is a home located in Hamilton County with nearby schools including Rising Stars at Carthage, Hartwell School, and Shroder High School.
Ownership History
Date
Name
Owned For
Owner Type
Purchase Details
Closed on
Oct 9, 2017
Sold by
Avi Properties Ltd
Bought by
Rak Tov Llc
Current Estimated Value
Purchase Details
Closed on
Mar 3, 2017
Sold by
Dibble Melissa L
Bought by
Avi Properties Ltd
Purchase Details
Closed on
Aug 11, 2015
Sold by
Morris Cynthia J
Bought by
Dibble Mellissa J
Purchase Details
Closed on
Aug 24, 2001
Sold by
Lakes Ruth H
Bought by
Dibble Norman
Purchase Details
Closed on
Aug 20, 2001
Sold by
Shriner Fred
Bought by
Dibble Norman E
Purchase Details
Closed on
Aug 16, 2001
Sold by
Shriner John
Bought by
Dibble Norman E
Create a Home Valuation Report for This Property
The Home Valuation Report is an in-depth analysis detailing your home's value as well as a comparison with similar homes in the area
Home Values in the Area
Average Home Value in this Area
Purchase History
| Date | Buyer | Sale Price | Title Company |
|---|---|---|---|
| Rak Tov Llc | -- | None Available | |
| Avi Properties Ltd | $21,000 | -- | |
| Dibble Mellissa J | -- | Attorney | |
| Dibble Norman | $30,000 | -- | |
| Dibble Norman E | $5,000 | -- | |
| Shriner John | -- | -- | |
| Dibble Norman E | $5,000 | -- |
Source: Public Records
Tax History Compared to Growth
Tax History
| Year | Tax Paid | Tax Assessment Tax Assessment Total Assessment is a certain percentage of the fair market value that is determined by local assessors to be the total taxable value of land and additions on the property. | Land | Improvement |
|---|---|---|---|---|
| 2024 | $1,012 | $15,771 | $5,859 | $9,912 |
| 2023 | $1,014 | $15,771 | $5,859 | $9,912 |
| 2022 | $616 | $8,527 | $3,140 | $5,387 |
| 2021 | $601 | $8,527 | $3,140 | $5,387 |
| 2020 | $603 | $8,527 | $3,140 | $5,387 |
| 2019 | $571 | $7,351 | $2,706 | $4,645 |
| 2018 | $572 | $7,351 | $2,706 | $4,645 |
| 2017 | $524 | $7,351 | $2,706 | $4,645 |
| 2016 | $679 | $9,415 | $3,605 | $5,810 |
| 2015 | $613 | $9,415 | $3,605 | $5,810 |
| 2014 | $617 | $9,415 | $3,605 | $5,810 |
| 2013 | $627 | $9,415 | $3,605 | $5,810 |
Source: Public Records
Map
Nearby Homes
- 206 W 69th St
- 219 W 70th St
- 137 W Sixty Sixth St
- 6510 Rosewood St
- 125 W 65th St
- 6605 Hasler Ln
- 120 W Seventy Second St
- 234 W 73rd St
- 529 W Sixty Third St
- 519 Maple St
- 412 Walnut St
- 314 Walnut St
- 6106 Sycamore St
- 6105 Sycamore St
- 6011 Vine St
- 117 Nansen St
- 3 Linden St
- 1139 Towanda Terrace
- 5914 Elmwood Ave
- 5703 Cedar Ave