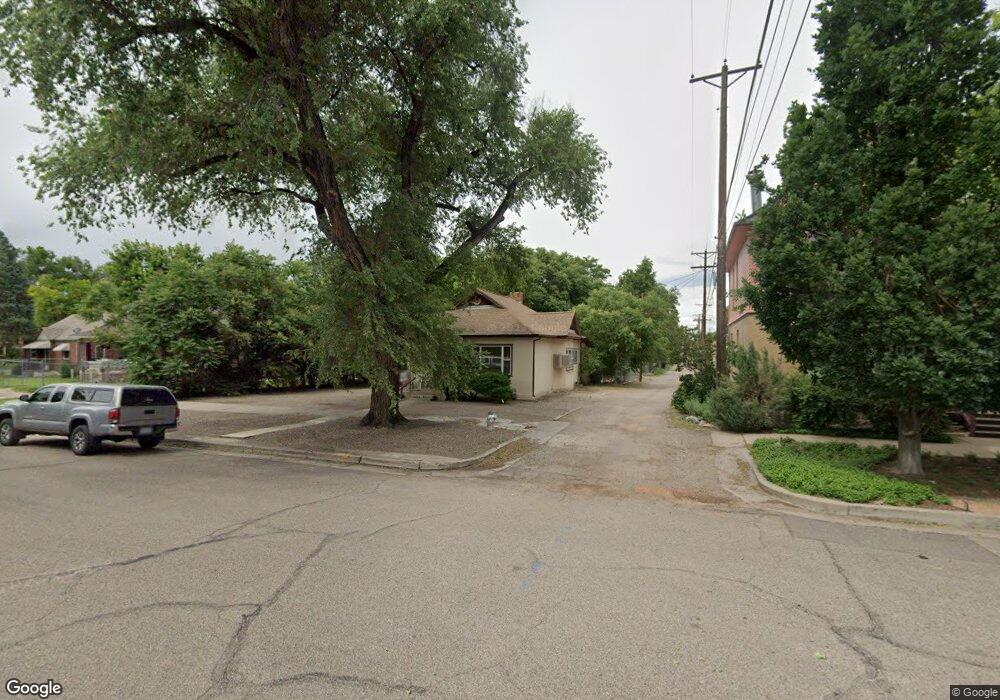
119 W Pitkin Ave Pueblo, CO 81004
Mesa Junction NeighborhoodEstimated Value: $200,377 - $236,000
2
Beds
1
Bath
1,173
Sq Ft
$189/Sq Ft
Est. Value
About This Home
This home is located at 119 W Pitkin Ave, Pueblo, CO 81004 and is currently estimated at $221,344, approximately $188 per square foot. 119 W Pitkin Ave is a home located in Pueblo County with nearby schools including Carlile Elementary School, Columbian Elementary School, and Pueblo Academy of Arts.
Ownership History
Date
Name
Owned For
Owner Type
Purchase Details
Closed on
Nov 5, 2002
Sold by
Reinsch Ronald B Trust
Bought by
Reinsch Real Estate Llc
Current Estimated Value
Purchase Details
Closed on
Dec 6, 2001
Sold by
Reinsch Ronald B
Bought by
Reinsch Ronald B Trust
Purchase Details
Closed on
Mar 4, 1994
Sold by
Reinsch Ronald B + Janice C
Bought by
Reinsch Ronald B
Purchase Details
Closed on
Nov 1, 1985
Sold by
Otero Savings + Loan Assoc
Bought by
Reinsch Ronald B + Janice C
Purchase Details
Closed on
Feb 9, 1984
Sold by
Oberg Floyd L + Emma E
Bought by
Otero Savings + Loan Assoc
Purchase Details
Closed on
Aug 2, 1982
Sold by
Wilcox Charles E
Bought by
Oberg Floyd L + Emma E
Purchase Details
Closed on
Sep 15, 1981
Sold by
Wolf Frankie Ann
Bought by
Wilcox Charles E
Purchase Details
Closed on
Jan 30, 1978
Sold by
Wolf Dan H + Frankie Ann
Bought by
Wolf Frankie Ann
Purchase Details
Closed on
Apr 10, 1970
Sold by
Lindahl and Price
Bought by
Pueblo Bank + Trust Co
Create a Home Valuation Report for This Property
The Home Valuation Report is an in-depth analysis detailing your home's value as well as a comparison with similar homes in the area
Home Values in the Area
Average Home Value in this Area
Purchase History
| Date | Buyer | Sale Price | Title Company |
|---|---|---|---|
| Reinsch Real Estate Llc | -- | -- | |
| Reinsch Ronald B Trust | -- | -- | |
| Reinsch Ronald B | -- | -- | |
| Reinsch Ronald B + Janice C | $28,000 | -- | |
| Otero Savings + Loan Assoc | -- | -- | |
| Oberg Floyd L + Emma E | $37,000 | -- | |
| Wilcox Charles E | $41,100 | -- | |
| Wolf Frankie Ann | -- | -- | |
| Pueblo Bank + Trust Co | -- | -- |
Source: Public Records
Tax History Compared to Growth
Tax History
| Year | Tax Paid | Tax Assessment Tax Assessment Total Assessment is a certain percentage of the fair market value that is determined by local assessors to be the total taxable value of land and additions on the property. | Land | Improvement |
|---|---|---|---|---|
| 2024 | $977 | $9,940 | -- | -- |
| 2023 | $988 | $13,620 | $1,470 | $12,150 |
| 2022 | $866 | $8,720 | $1,040 | $7,680 |
| 2021 | $893 | $8,970 | $1,070 | $7,900 |
| 2020 | $749 | $9,570 | $1,070 | $8,500 |
| 2019 | $749 | $7,418 | $730 | $6,688 |
| 2018 | $639 | $7,056 | $735 | $6,321 |
| 2017 | $646 | $7,056 | $735 | $6,321 |
| 2016 | $625 | $6,878 | $813 | $6,065 |
| 2015 | $590 | $6,878 | $813 | $6,065 |
| 2014 | $590 | $6,510 | $813 | $5,697 |
Source: Public Records
Map
Nearby Homes
- 309 Quincy St
- 412 Colorado Ave
- 412- 414 Colorado Ave
- 510 Quincy St
- 505 Quincy St
- 238 W Grant Ave
- 316 Broadway Ave
- 324 W Grant Ave
- 206 W Orman Ave
- 125 Jackson St
- 506 Van Buren St
- 222 W Abriendo Ave Unit 224
- 226 W Abriendo Ave
- 216 E Evans Ave
- 631 Colorado Ave
- 218 Polk St
- 317 E Evans Ave
- 113 Midway Ave
- 113 Midway Ave Unit 117
- 316 E Orman Ave
- 127 W Pitkin Ave
- 115 W Pitkin Ave
- 131 W Pitkin Ave
- 109 W Pitkin Ave
- 317 Colorado Ave
- 317 Colorado Ave Unit 319
- 316 Quincy St
- 323 Colorado Ave
- 327 Colorado Ave
- 312 Quincy St
- 329 Colorado Ave
- 118 W Pitkin Ave
- 124 W Pitkin Ave
- 114 W Pitkin Ave
- 308 Quincy St
- 126 W Pitkin Ave
- 315 Colorado Ave
- 130 W Pitkin Ave
- 309 Colorado Ave Unit 311
- 309 Colorado Ave