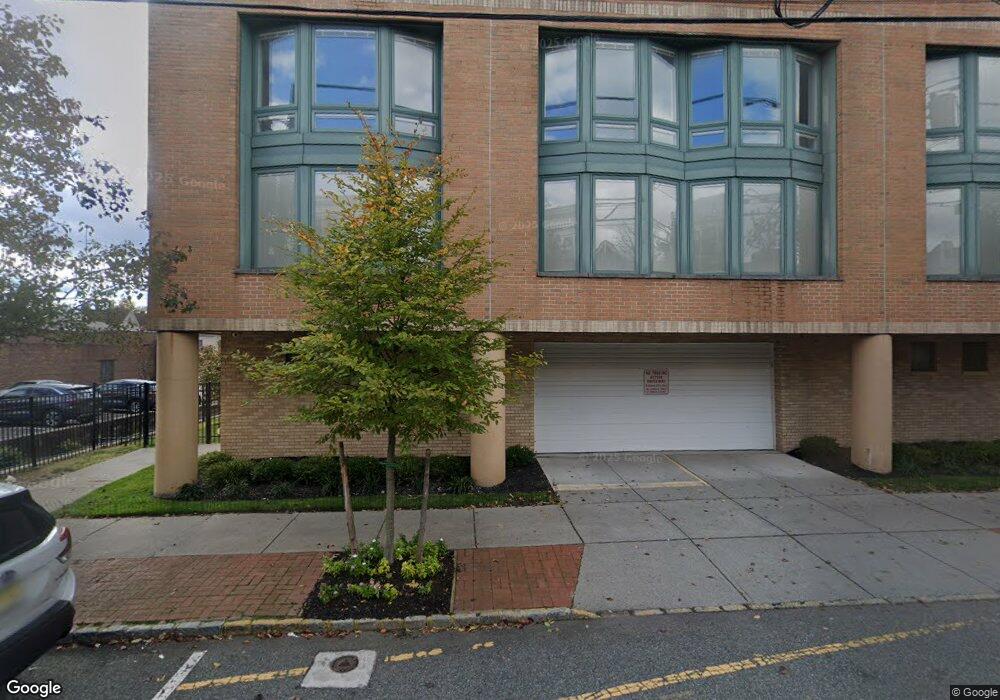
119 Walnut St Unit C0010 Montclair, NJ 07042
Estimated Value: $1,001,681 - $1,226,000
--
Bed
--
Bath
1,687
Sq Ft
$655/Sq Ft
Est. Value
About This Home
This home is located at 119 Walnut St Unit C0010, Montclair, NJ 07042 and is currently estimated at $1,104,170, approximately $654 per square foot. 119 Walnut St Unit C0010 is a home located in Essex County with nearby schools including Hillside School, Bradford School, and Charles H. Bullock School.
Ownership History
Date
Name
Owned For
Owner Type
Purchase Details
Closed on
Aug 15, 2023
Sold by
Egan Christopher
Bought by
Berardellli Christopher
Current Estimated Value
Home Financials for this Owner
Home Financials are based on the most recent Mortgage that was taken out on this home.
Original Mortgage
$728,000
Outstanding Balance
$709,201
Interest Rate
6.13%
Mortgage Type
New Conventional
Estimated Equity
$394,969
Purchase Details
Closed on
May 11, 2021
Sold by
Bertolotti Joseph
Bought by
Egan Christopher
Home Financials for this Owner
Home Financials are based on the most recent Mortgage that was taken out on this home.
Interest Rate
2.96%
Purchase Details
Closed on
Nov 19, 2010
Sold by
Ohagan Jeffrey and Ohagan Danielle
Bought by
Polese Michael P
Home Financials for this Owner
Home Financials are based on the most recent Mortgage that was taken out on this home.
Original Mortgage
$417,000
Interest Rate
4.25%
Mortgage Type
New Conventional
Create a Home Valuation Report for This Property
The Home Valuation Report is an in-depth analysis detailing your home's value as well as a comparison with similar homes in the area
Home Values in the Area
Average Home Value in this Area
Purchase History
| Date | Buyer | Sale Price | Title Company |
|---|---|---|---|
| Berardellli Christopher | $950,000 | Prestige Title | |
| Egan Christopher | $855,000 | -- | |
| Polese Michael P | $650,000 | Chicago Title Insurance Co |
Source: Public Records
Mortgage History
| Date | Status | Borrower | Loan Amount |
|---|---|---|---|
| Open | Berardellli Christopher | $728,000 | |
| Previous Owner | Egan Christopher | -- | |
| Previous Owner | Polese Michael P | $417,000 |
Source: Public Records
Tax History Compared to Growth
Tax History
| Year | Tax Paid | Tax Assessment Tax Assessment Total Assessment is a certain percentage of the fair market value that is determined by local assessors to be the total taxable value of land and additions on the property. | Land | Improvement |
|---|---|---|---|---|
| 2025 | $23,207 | $626,600 | $390,000 | $236,600 |
| 2024 | $23,207 | $686,600 | $450,000 | $236,600 |
| 2023 | $22,575 | $686,600 | $450,000 | $236,600 |
| 2022 | $22,575 | $686,600 | $450,000 | $236,600 |
| 2021 | $22,184 | $686,600 | $450,000 | $236,600 |
| 2020 | $21,827 | $686,600 | $450,000 | $236,600 |
| 2019 | $21,600 | $686,600 | $450,000 | $236,600 |
| 2018 | $21,243 | $686,600 | $450,000 | $236,600 |
| 2017 | $19,607 | $525,100 | $260,000 | $265,100 |
| 2016 | $19,082 | $525,100 | $260,000 | $265,100 |
| 2015 | $18,515 | $525,100 | $260,000 | $265,100 |
| 2014 | $17,895 | $525,100 | $260,000 | $265,100 |
Source: Public Records
Map
Nearby Homes
- 70 N Willow St
- 81 N Fullerton Ave
- 183 Claremont Ave
- 48 N Willow St
- 63 Greenwood Ave
- 101 Park St
- 21 Forest St
- 37 Montclair Ave
- 76 Grove St Unit 4
- 76 Grove St
- 197 N Fullerton Ave
- 92-94 Midland Ave
- 69 Christopher St
- 9 Vincent Place
- 58 Cambridge Rd
- 5 Roosevelt Place Unit 1A
- 62 Montague Place Unit 64
- 6 William St
- 5 Roosevelt Place
- 301 Claremont Ave Unit 1
- 119 Walnut St Unit 6
- 119 Walnut St Unit 7
- 119 Walnut St Unit 9
- 119 Walnut St Unit C0005
- 119 Walnut St Unit C0002
- 119 Walnut St Unit C0001
- 119 Walnut St Unit C0003
- 119 Walnut St Unit C0009
- 119 Walnut St Unit C0008
- 119 Walnut St Unit C0007
- 119 Walnut St Unit C0006
- 119 Walnut St Unit C0004
- 119 Walnut St Unit 10
- 119 Walnut St Unit 1
- 119 Walnut St
- 119 Walnut St Unit 8
- 119 Walnut St Unit 3
- 115 Walnut St
- 75 Forest St Unit 77
- 123 Walnut St