C
Seller's Agent in 2025
Cline Wooten
Gold Sky Properties LLC
(912) 675-6085
Estimated Value: $339,086 - $371,000
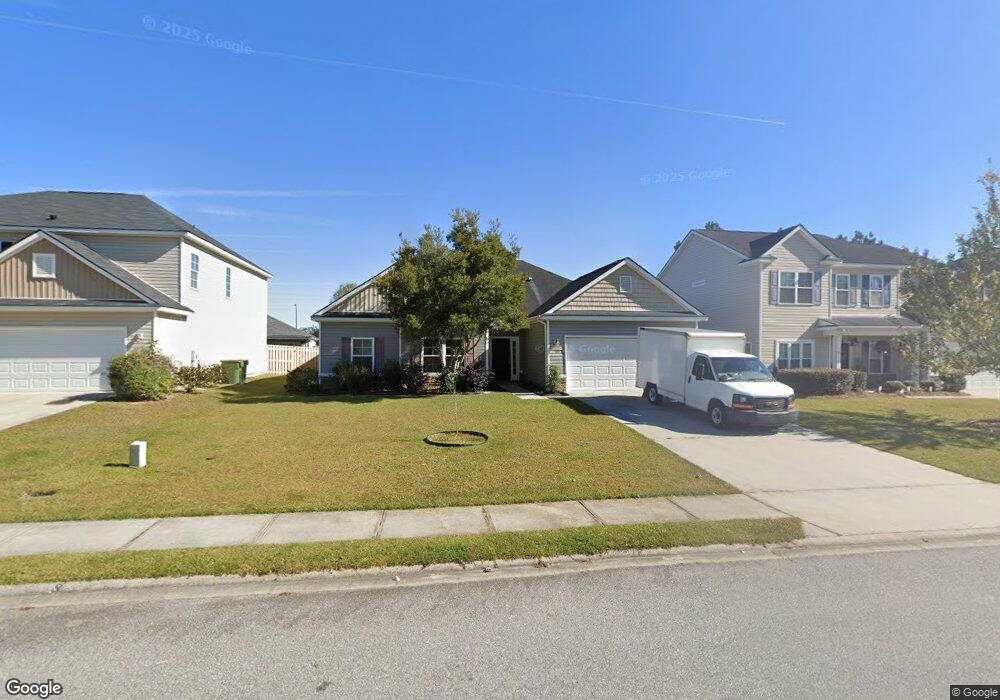
This home is located at 119 Waverly Way, Savannah, GA 31407 and is currently estimated at $356,272, approximately $176 per square foot. 119 Waverly Way is a home located in Chatham County with nearby schools including Godley Station School, Groves High School, and Savannah Adventist Christian School.
| Date | Buyer | Sale Price | Title Company |
|---|---|---|---|
| Mitcham Nicolas Aaron | $350,000 | -- | |
| Whitmore Patrick | $220,000 | -- |
| Date | Status | Borrower | Loan Amount |
|---|---|---|---|
| Open | Mitcham Nicolas Aaron | $338,318 | |
| Previous Owner | Whitmore Patrick | $176,000 |
| Date | Event | Price | List to Sale | Price per Sq Ft | Prior Sale |
|---|---|---|---|---|---|
| 11/17/2025 11/17/25 | Rented | $2,450 | 0.0% | -- | |
| 10/22/2025 10/22/25 | Price Changed | $2,450 | -2.0% | $1 / Sq Ft | |
| 09/05/2025 09/05/25 | For Rent | $2,500 | 0.0% | -- | |
| 01/24/2025 01/24/25 | Sold | $350,000 | 0.0% | $173 / Sq Ft | View Prior Sale |
| 12/24/2024 12/24/24 | Price Changed | $350,000 | -2.8% | $173 / Sq Ft | |
| 11/15/2024 11/15/24 | Price Changed | $359,900 | -1.4% | $178 / Sq Ft | |
| 11/09/2024 11/09/24 | For Sale | $365,000 | 0.0% | $181 / Sq Ft | |
| 11/09/2024 11/09/24 | Off Market | $365,000 | -- | -- | |
| 10/16/2024 10/16/24 | For Sale | $365,000 | +86.4% | $181 / Sq Ft | |
| 03/13/2015 03/13/15 | Sold | $195,789 | +0.4% | $111 / Sq Ft | View Prior Sale |
| 02/10/2015 02/10/15 | Pending | -- | -- | -- | |
| 08/06/2014 08/06/14 | For Sale | $194,989 | -- | $111 / Sq Ft |
| Year | Tax Paid | Tax Assessment Tax Assessment Total Assessment is a certain percentage of the fair market value that is determined by local assessors to be the total taxable value of land and additions on the property. | Land | Improvement |
|---|---|---|---|---|
| 2025 | $4,556 | $140,640 | $22,000 | $118,640 |
| 2024 | $4,556 | $139,480 | $22,000 | $117,480 |
| 2023 | $1,483 | $121,520 | $15,800 | $105,720 |
| 2022 | $1,357 | $111,200 | $15,800 | $95,400 |
| 2021 | $3,802 | $88,000 | $15,400 | $72,600 |
| 2020 | $2,558 | $87,880 | $15,800 | $72,080 |
| 2019 | $3,599 | $81,000 | $15,800 | $65,200 |
| 2015 | $3,181 | $15,620 | $0 | $0 |
| 2014 | $361 | $8,800 | $0 | $0 |
C
Seller's Agent in 2025
Cline Wooten
Gold Sky Properties LLC
(912) 675-6085

Seller's Agent in 2025
Steffany Farmer
Better Homes and Gardens Real
(912) 484-5552
16 Total Sales
Buyer's Agent in 2025
Abram Taylor
Realty One Group Inclusion
(706) 495-1242
3 in this area
69 Total Sales
Seller's Agent in 2015
Nadine Torres
Realty One Group Inclusion
(912) 247-1980
A
Buyer's Agent in 2015
Agent Rick Fitzer
Integrity Real Estate LLC