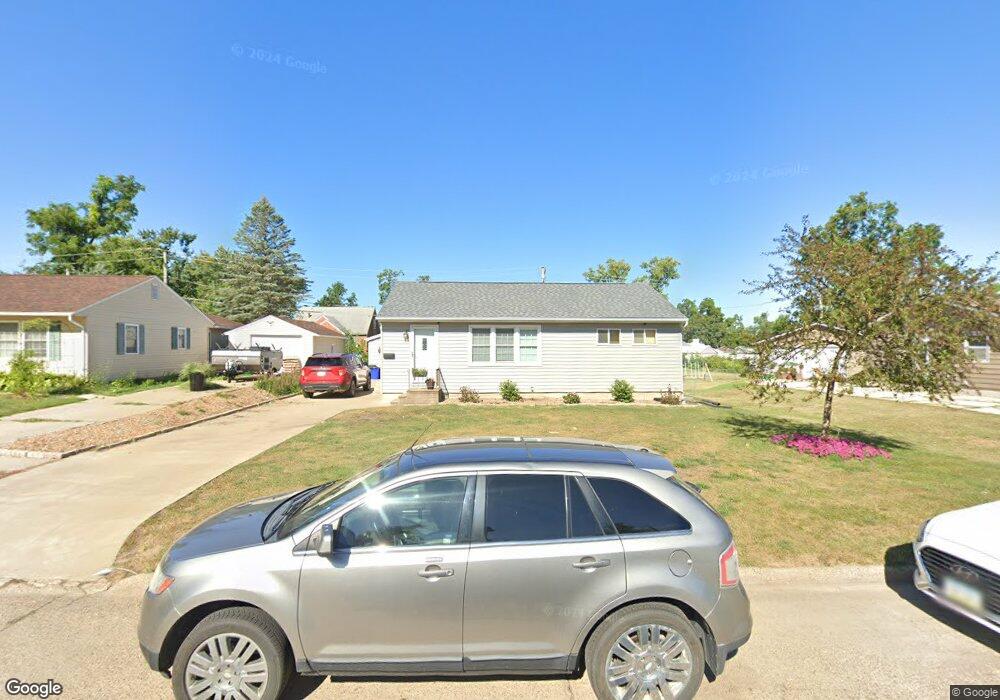
1190 Maplecrest Dr Marion, IA 52302
Estimated Value: $201,000 - $225,537
3
Beds
1
Bath
936
Sq Ft
$228/Sq Ft
Est. Value
About This Home
This home is located at 1190 Maplecrest Dr, Marion, IA 52302 and is currently estimated at $213,634, approximately $228 per square foot. 1190 Maplecrest Dr is a home located in Linn County with nearby schools including Longfellow Elementary, Francis Marion Intermediate School, and Vernon Middle School.
Ownership History
Date
Name
Owned For
Owner Type
Purchase Details
Closed on
Jul 23, 2013
Sold by
Strong Justin A and Strong Kari E
Bought by
Krug Stacy L
Current Estimated Value
Home Financials for this Owner
Home Financials are based on the most recent Mortgage that was taken out on this home.
Original Mortgage
$137,365
Outstanding Balance
$100,947
Interest Rate
4.25%
Mortgage Type
FHA
Estimated Equity
$112,687
Purchase Details
Closed on
Mar 9, 2006
Sold by
Karr Kevin P and Karr Cristin L
Bought by
Strong Justin A
Home Financials for this Owner
Home Financials are based on the most recent Mortgage that was taken out on this home.
Original Mortgage
$94,400
Interest Rate
6.33%
Mortgage Type
Fannie Mae Freddie Mac
Purchase Details
Closed on
Jan 14, 2004
Sold by
Crowley Steven E and Crowley Julie K
Bought by
Davis Thomas Clay and Davis Kathryn Ann
Create a Home Valuation Report for This Property
The Home Valuation Report is an in-depth analysis detailing your home's value as well as a comparison with similar homes in the area
Home Values in the Area
Average Home Value in this Area
Purchase History
| Date | Buyer | Sale Price | Title Company |
|---|---|---|---|
| Krug Stacy L | $140,000 | None Available | |
| Strong Justin A | $117,500 | None Available | |
| Davis Thomas Clay | $103,500 | -- |
Source: Public Records
Mortgage History
| Date | Status | Borrower | Loan Amount |
|---|---|---|---|
| Open | Krug Stacy L | $137,365 | |
| Previous Owner | Strong Justin A | $94,400 |
Source: Public Records
Tax History
| Year | Tax Paid | Tax Assessment Tax Assessment Total Assessment is a certain percentage of the fair market value that is determined by local assessors to be the total taxable value of land and additions on the property. | Land | Improvement |
|---|---|---|---|---|
| 2025 | $3,798 | $233,900 | $17,800 | $216,100 |
| 2024 | $3,330 | $212,800 | $17,800 | $195,000 |
| 2023 | $3,330 | $212,800 | $17,800 | $195,000 |
| 2022 | $3,214 | $158,500 | $17,800 | $140,700 |
| 2021 | $3,086 | $158,500 | $17,800 | $140,700 |
| 2020 | $3,086 | $145,100 | $17,800 | $127,300 |
| 2019 | $2,854 | $145,100 | $17,800 | $127,300 |
| 2018 | $2,786 | $135,200 | $17,800 | $117,400 |
| 2017 | $2,776 | $131,500 | $17,800 | $113,700 |
| 2016 | $2,926 | $131,500 | $17,800 | $113,700 |
| 2015 | $2,625 | $118,500 | $17,800 | $100,700 |
| 2014 | $2,364 | $118,500 | $17,800 | $100,700 |
| 2013 | $2,334 | $118,500 | $17,800 | $100,700 |
Source: Public Records
Map
Nearby Homes
- 1170 Maplecrest Dr
- 1198 Maplecrest Dr
- 1160 Maplecrest Dr
- 1263 Washington Dr
- 1257 Washington Dr
- 1200 Maplecrest Dr
- 1251 Washington Dr
- 1185 Maplecrest Dr
- 1175 Maplecrest Dr
- 1150 Maplecrest Dr
- 1230 Maplecrest Dr
- 1245 Washington Dr
- 1165 Maplecrest Dr
- 1269 Washington Dr
- 2000 12th Ave
- 1140 Maplecrest Dr
- 1225 Washington Dr
- 1155 Maplecrest Dr
- 1225 Maplecrest Dr
- 1270 Maplecrest Dr
Your Personal Tour Guide
Ask me questions while you tour the home.