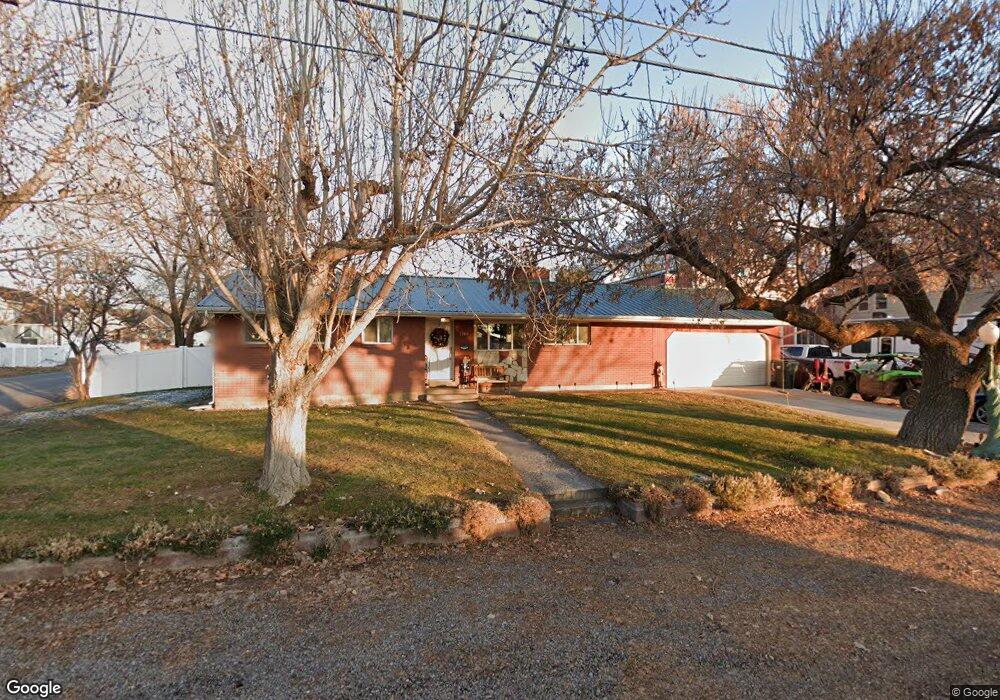
1190 N 300 W Mapleton, UT 84664
Estimated Value: $450,000 - $597,799
4
Beds
3
Baths
2,272
Sq Ft
$234/Sq Ft
Est. Value
About This Home
This home is located at 1190 N 300 W, Mapleton, UT 84664 and is currently estimated at $532,450, approximately $234 per square foot. 1190 N 300 W is a home located in Utah County with nearby schools including Mapleton School, Mapleton Junior High School, and Maple Mountain High School.
Ownership History
Date
Name
Owned For
Owner Type
Purchase Details
Closed on
May 16, 2013
Sold by
Re Investments Llc
Bought by
Williams Steffanie R
Current Estimated Value
Home Financials for this Owner
Home Financials are based on the most recent Mortgage that was taken out on this home.
Original Mortgage
$182,000
Outstanding Balance
$126,604
Interest Rate
3.38%
Mortgage Type
VA
Estimated Equity
$405,846
Purchase Details
Closed on
Jan 25, 2013
Sold by
Clark Scott and Clark Loretta
Bought by
Re Investments Llc
Purchase Details
Closed on
Oct 28, 1996
Sold by
Oates Barry and Oates Karen
Bought by
Clark Scott and Clark Loretta
Home Financials for this Owner
Home Financials are based on the most recent Mortgage that was taken out on this home.
Original Mortgage
$98,400
Interest Rate
8.14%
Create a Home Valuation Report for This Property
The Home Valuation Report is an in-depth analysis detailing your home's value as well as a comparison with similar homes in the area
Home Values in the Area
Average Home Value in this Area
Purchase History
| Date | Buyer | Sale Price | Title Company |
|---|---|---|---|
| Williams Steffanie R | -- | Select Title Insurace Agency | |
| Re Investments Llc | $112,923 | Select Title Ins Agency | |
| Clark Scott | -- | Title West |
Source: Public Records
Mortgage History
| Date | Status | Borrower | Loan Amount |
|---|---|---|---|
| Open | Williams Steffanie R | $182,000 | |
| Previous Owner | Clark Scott | $98,400 | |
| Closed | Clark Scott | $12,300 |
Source: Public Records
Tax History
| Year | Tax Paid | Tax Assessment Tax Assessment Total Assessment is a certain percentage of the fair market value that is determined by local assessors to be the total taxable value of land and additions on the property. | Land | Improvement |
|---|---|---|---|---|
| 2025 | $2,677 | $282,700 | -- | -- |
| 2024 | $2,677 | $262,240 | $0 | $0 |
| 2023 | $2,752 | $271,260 | $0 | $0 |
| 2022 | $2,798 | $272,745 | $0 | $0 |
| 2021 | $2,269 | $339,600 | $181,400 | $158,200 |
| 2020 | $2,202 | $318,700 | $160,500 | $158,200 |
| 2019 | $1,973 | $291,600 | $154,000 | $137,600 |
| 2018 | $1,885 | $265,100 | $129,700 | $135,400 |
| 2017 | $1,767 | $131,890 | $0 | $0 |
| 2016 | $1,468 | $108,955 | $0 | $0 |
| 2015 | $1,386 | $102,245 | $0 | $0 |
| 2014 | $1,298 | $93,995 | $0 | $0 |
Source: Public Records
Map
Nearby Homes
Your Personal Tour Guide
Ask me questions while you tour the home.