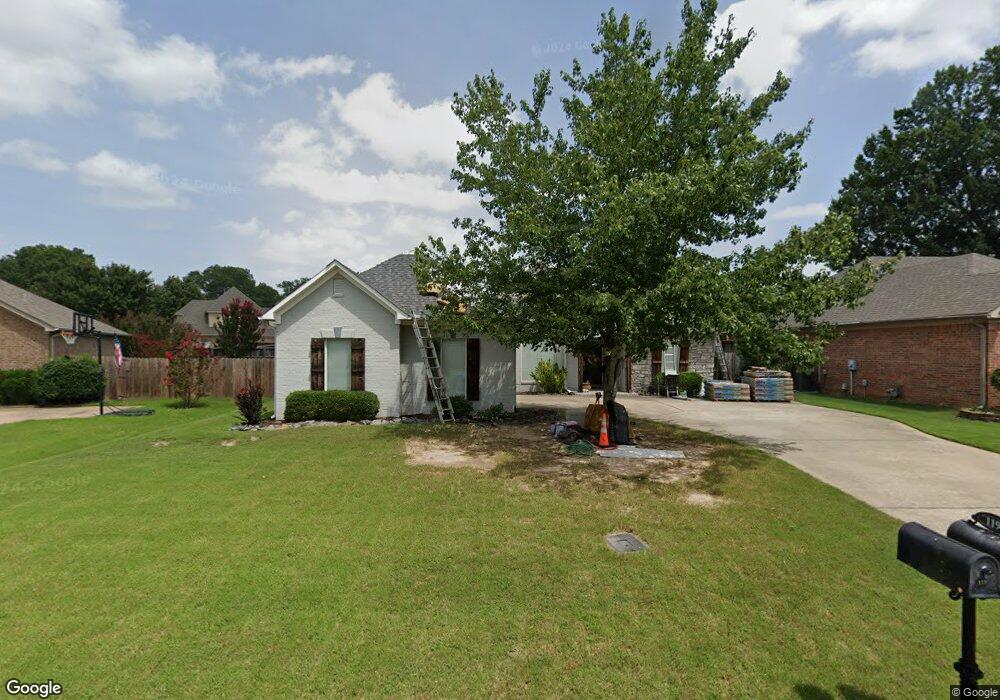
1190 Trillium Dr Conway, AR 72034
Downtown Conway NeighborhoodEstimated Value: $261,189 - $281,000
--
Bed
2
Baths
1,570
Sq Ft
$172/Sq Ft
Est. Value
About This Home
This home is located at 1190 Trillium Dr, Conway, AR 72034 and is currently estimated at $269,297, approximately $171 per square foot. 1190 Trillium Dr is a home located in Faulkner County with nearby schools including Julia Lee Moore Elementary School, Conway Junior High School, and Conway High School.
Ownership History
Date
Name
Owned For
Owner Type
Purchase Details
Closed on
Mar 1, 2017
Sold by
Crowell Crowell R and Crowell Peggy
Bought by
Moore Sarah K
Current Estimated Value
Home Financials for this Owner
Home Financials are based on the most recent Mortgage that was taken out on this home.
Original Mortgage
$119,000
Outstanding Balance
$98,461
Interest Rate
4.09%
Mortgage Type
New Conventional
Estimated Equity
$170,836
Purchase Details
Closed on
Nov 19, 2009
Bought by
To Trustee Crowell Joint Trust
Purchase Details
Closed on
Nov 13, 2007
Bought by
Crowell
Purchase Details
Closed on
Nov 9, 2007
Sold by
Howard Angela and Howard Timothy
Bought by
Crowell R S and Crowell Peggy
Purchase Details
Closed on
Apr 24, 2002
Bought by
Howard
Purchase Details
Closed on
Nov 28, 2001
Bought by
Boone
Create a Home Valuation Report for This Property
The Home Valuation Report is an in-depth analysis detailing your home's value as well as a comparison with similar homes in the area
Home Values in the Area
Average Home Value in this Area
Purchase History
| Date | Buyer | Sale Price | Title Company |
|---|---|---|---|
| Moore Sarah K | $164,000 | Realty Title | |
| To Trustee Crowell Joint Trust | -- | -- | |
| Crowell Trust | -- | -- | |
| Crowell | $147,000 | -- | |
| Crowell R S | $147,000 | Conway Title Svcs & Escrow I | |
| Crowell | $147,000 | -- | |
| Howard | $137,000 | -- | |
| Boone | $26,000 | -- |
Source: Public Records
Mortgage History
| Date | Status | Borrower | Loan Amount |
|---|---|---|---|
| Open | Moore Sarah K | $119,000 |
Source: Public Records
Tax History Compared to Growth
Tax History
| Year | Tax Paid | Tax Assessment Tax Assessment Total Assessment is a certain percentage of the fair market value that is determined by local assessors to be the total taxable value of land and additions on the property. | Land | Improvement |
|---|---|---|---|---|
| 2024 | $1,796 | $46,060 | $4,000 | $42,060 |
| 2023 | $1,711 | $33,810 | $4,000 | $29,810 |
| 2022 | $1,277 | $33,810 | $4,000 | $29,810 |
| 2021 | $1,202 | $33,810 | $4,000 | $29,810 |
| 2020 | $1,127 | $29,680 | $4,000 | $25,680 |
| 2019 | $1,127 | $29,680 | $4,000 | $25,680 |
| 2018 | $1,152 | $29,680 | $4,000 | $25,680 |
| 2017 | $1,152 | $29,680 | $4,000 | $25,680 |
| 2016 | $1,502 | $29,680 | $4,000 | $25,680 |
| 2015 | $1,422 | $28,110 | $4,000 | $24,110 |
| 2014 | $1,422 | $28,110 | $4,000 | $24,110 |
Source: Public Records
Map
Nearby Homes
- 1130 Applewood Dr
- 50 White Oak Dr
- 18 Riviera Dr
- 21 Riviera Dr
- 1545 Winterbrook Dr
- 11 Red Oak Dr
- 1060 Turnberry Dr
- 1715 Plymouth Dr
- 46 Shady Lane Dr
- 1045 Edinburgh Dr
- 1115 Salem Rd
- 1145 Salem Rd
- 1240 Salem Rd
- 3525 Juniper Dr
- 1500 Haley Ln
- 3801 W Tyler St
- 3770 Prince St
- 8 Smoking Oaks Rd
- 4690 College Ave
- 3955 College Ave
- 1180 Trillium Dr
- 1198 Trillium Dr
- 1145 Applewood Dr
- 1135 Applewood Dr
- 1170 Trillium Dr
- 1195 Trillium Dr
- 1185 Trillium Dr
- 1155 Applewood Dr
- 1125 Applewood Dr
- 1160 Trillium Dr
- 1175 Trillium Dr
- 3310 Forsythia Dr
- 1165 Trillium Dr
- 1150 Trillium Dr
- 1180 Crimson Clover Dr
- 1190 Crimson Clover Dr
- 3320 Forsythia Dr
- 1150 Applewood Dr
- 1170 Crimson Clover Dr
- 7 Riviera Dr