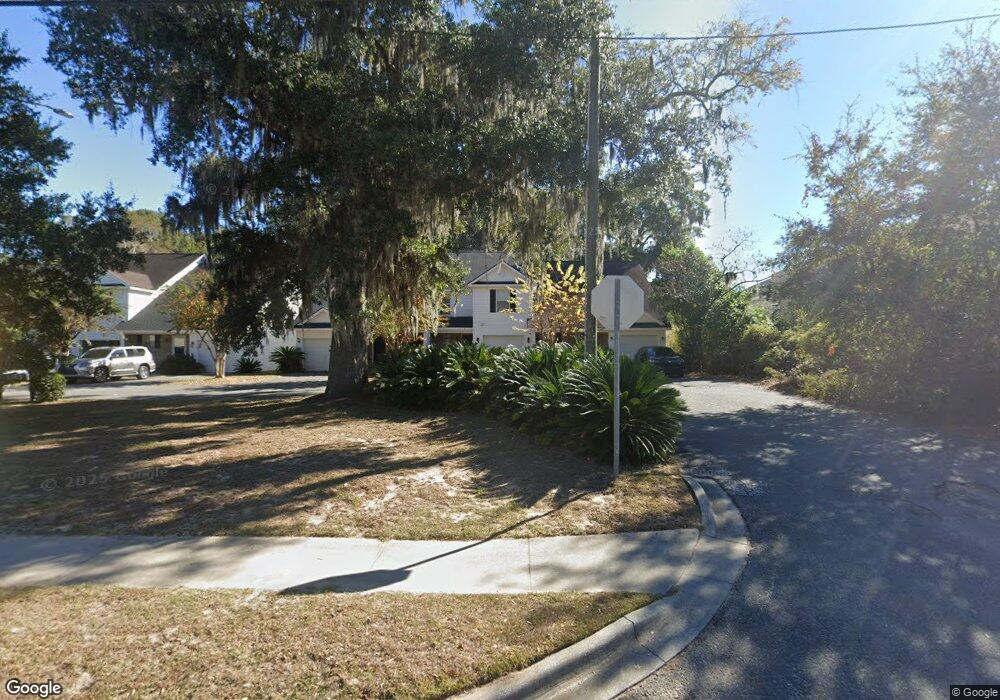
11903 Apache Ave Savannah, GA 31419
Wilshire Estates NeighborhoodEstimated Value: $236,601 - $276,000
3
Beds
2
Baths
1,412
Sq Ft
$183/Sq Ft
Est. Value
About This Home
This home is located at 11903 Apache Ave, Savannah, GA 31419 and is currently estimated at $257,900, approximately $182 per square foot. 11903 Apache Ave is a home located in Chatham County with nearby schools including Windsor Forest High School, Southwest Elementary School, and Southwest Middle School.
Ownership History
Date
Name
Owned For
Owner Type
Purchase Details
Closed on
Oct 18, 2021
Sold by
Alhatemi Abdullah
Bought by
Pineda Reinaldo and Pineda Diana
Current Estimated Value
Purchase Details
Closed on
Nov 18, 2019
Sold by
Kirk Shannon Marie
Bought by
Alhatemi Abdullah and Musleh Islam
Home Financials for this Owner
Home Financials are based on the most recent Mortgage that was taken out on this home.
Original Mortgage
$122,400
Interest Rate
3.6%
Mortgage Type
New Conventional
Purchase Details
Closed on
Dec 2, 2011
Bought by
Kirk Shannon Marie
Home Financials for this Owner
Home Financials are based on the most recent Mortgage that was taken out on this home.
Original Mortgage
$92,591
Interest Rate
4.06%
Mortgage Type
FHA
Create a Home Valuation Report for This Property
The Home Valuation Report is an in-depth analysis detailing your home's value as well as a comparison with similar homes in the area
Home Values in the Area
Average Home Value in this Area
Purchase History
| Date | Buyer | Sale Price | Title Company |
|---|---|---|---|
| Pineda Reinaldo | $199,500 | -- | |
| Alhatemi Abdullah | $136,000 | -- | |
| Kirk Shannon Marie | $95,000 | -- | |
| Kirk Shannon Marie | $95,000 | -- |
Source: Public Records
Mortgage History
| Date | Status | Borrower | Loan Amount |
|---|---|---|---|
| Previous Owner | Alhatemi Abdullah | $122,400 | |
| Previous Owner | Kirk Shannon Marie | $92,591 |
Source: Public Records
Tax History Compared to Growth
Tax History
| Year | Tax Paid | Tax Assessment Tax Assessment Total Assessment is a certain percentage of the fair market value that is determined by local assessors to be the total taxable value of land and additions on the property. | Land | Improvement |
|---|---|---|---|---|
| 2025 | $1,600 | $70,240 | $14,000 | $56,240 |
| 2024 | $1,600 | $69,280 | $14,000 | $55,280 |
| 2023 | $1,014 | $83,080 | $14,000 | $69,080 |
| 2022 | $904 | $74,120 | $14,000 | $60,120 |
| 2021 | $2,193 | $50,800 | $10,000 | $40,800 |
| 2020 | $1,427 | $50,840 | $10,000 | $40,840 |
| 2019 | $2,008 | $45,200 | $10,000 | $35,200 |
| 2018 | $1,973 | $43,880 | $10,000 | $33,880 |
| 2017 | $1,818 | $44,080 | $10,000 | $34,080 |
| 2016 | $1,267 | $43,440 | $10,000 | $33,440 |
| 2015 | $1,845 | $44,240 | $10,000 | $34,240 |
| 2014 | $2,449 | $44,240 | $0 | $0 |
Source: Public Records
Map
Nearby Homes
- 69 Hidden Lake Ct
- 59 Hidden Lake Ct
- 57 Hidden Lake Ct
- 1027 Mohawk St
- 40 Hidden Lake Ct
- 49 Hidden Lake Ct
- 1025 Mohawk St
- 1027 Dutchtown Rd
- 1159 Mohawk St Unit H3
- 1159 Mohawk St
- 1159 Mohawk St Unit B3
- 28 Kingslan Ct
- 519 San Anton Dr
- 40 Hidden Pointe Dr
- 118 Hidden Way
- 116 Hidden Way
- 121 Hopeland Dr
- 114 Hidden Way
- 112 Hidden Way
- 39 Hidden Pointe Dr
- 11903 Apache Ave Unit 5
- 11903 Apache Ave Unit 6
- 11903 Apache Ave Unit 4
- 11903 Apache Ave Unit 3
- 11903 Apache Ave
- 11903 Apache Ave
- 11903 Apache Ave
- 11903 Apache Ave
- 11903 Apache Ave
- 11903 Apache Ave Unit 2
- 11907 Apache Ave
- 11904 Apache Ave
- 11902 Apache Ave
- 11910 Apache Ave
- 11908 Apache Ave
- 101 Grey Oak Ct
- 1105 Mohawk St
- 103 Grey Oak Ct
- 105 Grey Oak Ct
- 102 Grey Oak Ct