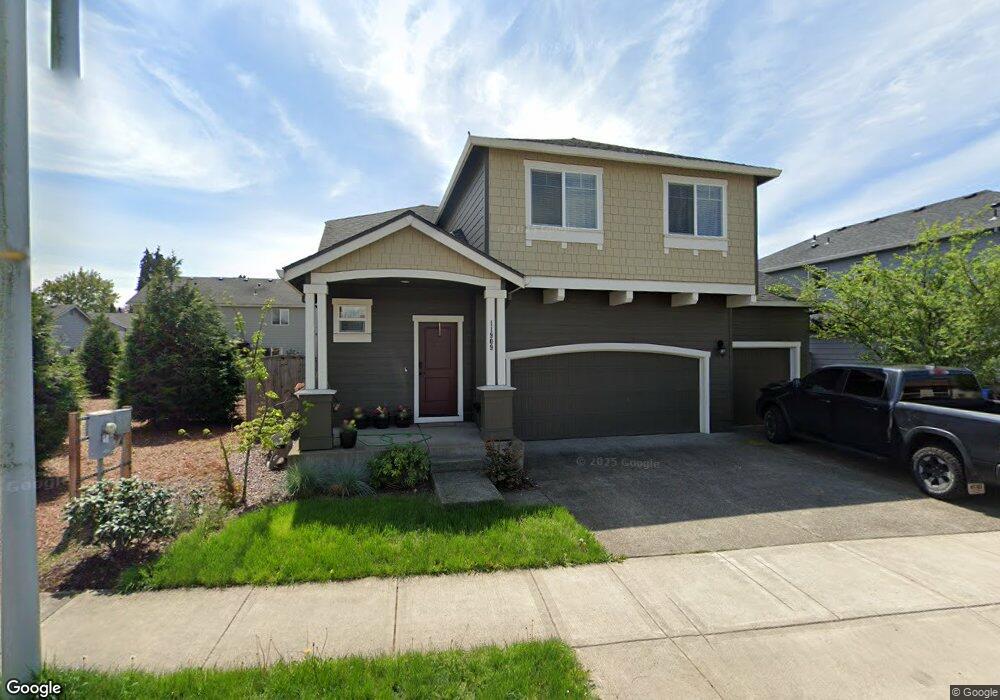
11909 NE 103rd St Unit 50 Vancouver, WA 98682
Orchards Area NeighborhoodEstimated Value: $504,641 - $543,000
4
Beds
3
Baths
2,038
Sq Ft
$258/Sq Ft
Est. Value
About This Home
This home is located at 11909 NE 103rd St Unit 50, Vancouver, WA 98682 and is currently estimated at $525,410, approximately $257 per square foot. 11909 NE 103rd St Unit 50 is a home located in Clark County with nearby schools including Glenwood Heights Primary School, Laurin Middle School, and Prairie High School.
Ownership History
Date
Name
Owned For
Owner Type
Purchase Details
Closed on
Aug 14, 2020
Sold by
Killinger Rebecca J and Killinger Brock E
Bought by
Killinger Brock E
Current Estimated Value
Home Financials for this Owner
Home Financials are based on the most recent Mortgage that was taken out on this home.
Original Mortgage
$345,782
Outstanding Balance
$306,733
Interest Rate
3%
Mortgage Type
New Conventional
Estimated Equity
$218,677
Purchase Details
Closed on
Feb 7, 2019
Sold by
Fountain Village Llc
Bought by
Killinger Brock E
Home Financials for this Owner
Home Financials are based on the most recent Mortgage that was taken out on this home.
Original Mortgage
$329,800
Interest Rate
4.5%
Mortgage Type
New Conventional
Purchase Details
Closed on
Oct 10, 2016
Sold by
D R Horton Inc Portland
Bought by
Fountain Village Llc
Purchase Details
Closed on
May 25, 2016
Sold by
Fountain Village Llc
Bought by
Dr Horton Inc Portland
Create a Home Valuation Report for This Property
The Home Valuation Report is an in-depth analysis detailing your home's value as well as a comparison with similar homes in the area
Home Values in the Area
Average Home Value in this Area
Purchase History
| Date | Buyer | Sale Price | Title Company |
|---|---|---|---|
| Killinger Brock E | -- | Fidelity National Title | |
| Killinger Brock E | $340,000 | Cascade Title Co | |
| Fountain Village Llc | $314,995 | First Amer Title Vancouver | |
| Dr Horton Inc Portland | -- | Cascade Title Company | |
| Inc-Portland Dr Horton | $1,285,000 | Cascade Title Company |
Source: Public Records
Mortgage History
| Date | Status | Borrower | Loan Amount |
|---|---|---|---|
| Open | Killinger Brock E | $345,782 | |
| Closed | Killinger Brock E | $329,800 |
Source: Public Records
Tax History Compared to Growth
Tax History
| Year | Tax Paid | Tax Assessment Tax Assessment Total Assessment is a certain percentage of the fair market value that is determined by local assessors to be the total taxable value of land and additions on the property. | Land | Improvement |
|---|---|---|---|---|
| 2025 | $3,983 | $485,131 | $133,400 | $351,731 |
| 2024 | $3,872 | $466,792 | $133,400 | $333,392 |
| 2023 | $4,085 | $504,412 | $138,000 | $366,412 |
| 2022 | $3,786 | $492,048 | $150,650 | $341,398 |
| 2021 | $3,809 | $413,534 | $126,500 | $287,034 |
| 2020 | $3,673 | $376,905 | $115,000 | $261,905 |
| 2019 | $3,157 | $353,620 | $108,750 | $244,870 |
| 2018 | $3,698 | $344,104 | $0 | $0 |
| 2017 | $1,850 | $306,350 | $0 | $0 |
| 2016 | -- | $167,150 | $0 | $0 |
Source: Public Records
Map
Nearby Homes
- 10407 NE 119th Ave
- 10407 NE 120th Place
- 10403 NE 120th Place
- Myrtle Plan at Saddle Club Estates
- Stonebridge Plan at Saddle Club Estates - Townhomes
- Autumn Plan at Saddle Club Estates - Townhomes
- Woodbridge Plan at Saddle Club Estates - Townhomes
- Summer Plan at Saddle Club Estates - Townhomes
- 11823 NE 105th St
- 10411 NE 120th Place
- 10402 NE 121st Ave
- 10406 NE 121st Ave
- 10410 NE 121st Ave
- 10317 NE 116th Place
- 10426 NE 121st Ave
- 10200 NE 123rd Ct
- 10521 NE 120th Place
- 10603 NE 120th Place
- 10625 NE 121st Ave
- 10703 NE 121st Ave
- 11909 NE 103rd St
- 11909 NE 103rd St
- 11905 NE 103rd St
- 11905 NE 103rd St Unit Lot49
- 11905 NE 103rd St
- 11910 NE 102nd St
- 11910 NE 102nd St
- 11906 NE 102nd St
- 11901 NE 103rd St Unit Lot48
- 11901 NE 103rd St
- 11914 NE 102nd St
- 11914 NE 102nd St
- 11906 NE 102nd St
- 11902 NE 102nd St
- 11902 NE 102nd St
- 11918 NE 102nd St
- 11918 NE 102nd St
- 11815 NE 103rd St Unit Lot47
- 11922 NE 102nd St
- 11812 NE 102nd St