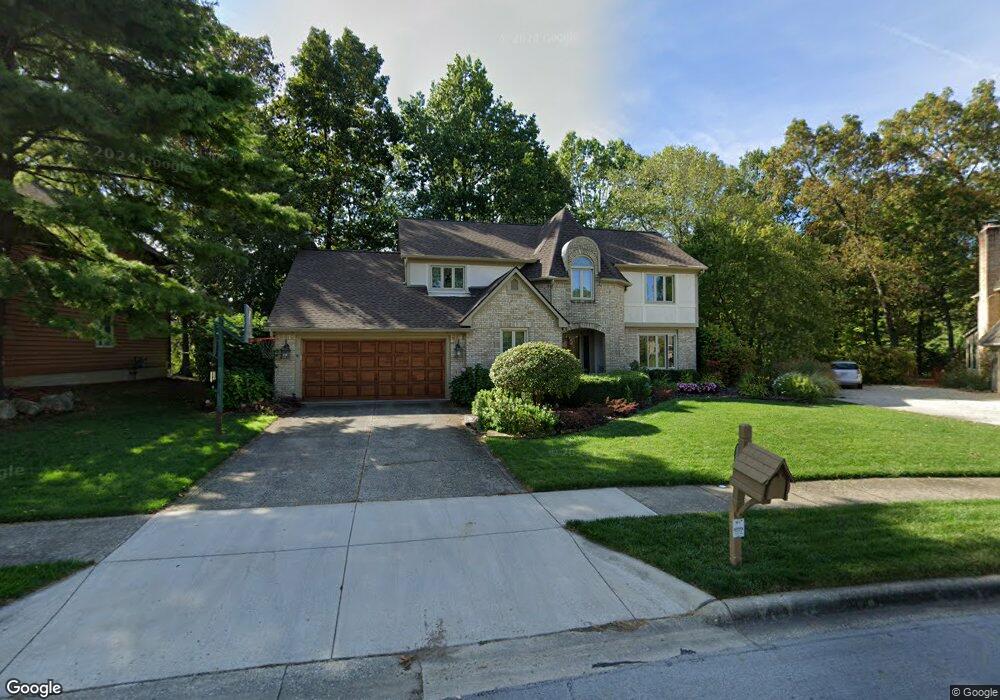
1191 3 Forks Dr N Westerville, OH 43081
Estimated Value: $513,000 - $580,000
4
Beds
3
Baths
2,765
Sq Ft
$197/Sq Ft
Est. Value
About This Home
This home is located at 1191 3 Forks Dr N, Westerville, OH 43081 and is currently estimated at $545,715, approximately $197 per square foot. 1191 3 Forks Dr N is a home located in Franklin County with nearby schools including Mcvay Elementary School, Walnut Springs Middle School, and Westerville-North High School.
Ownership History
Date
Name
Owned For
Owner Type
Purchase Details
Closed on
May 11, 2023
Sold by
Reichman Christopher A and Reichman Tami M
Bought by
Long Mary and Long Andrew
Current Estimated Value
Home Financials for this Owner
Home Financials are based on the most recent Mortgage that was taken out on this home.
Original Mortgage
$408,000
Outstanding Balance
$393,346
Interest Rate
4.95%
Mortgage Type
New Conventional
Estimated Equity
$152,369
Purchase Details
Closed on
Sep 29, 2008
Sold by
Wike Terry L and Doughty Wike Teresa L
Bought by
Reichman Christopher A and Reichman Tami M
Home Financials for this Owner
Home Financials are based on the most recent Mortgage that was taken out on this home.
Original Mortgage
$95,100
Interest Rate
6.41%
Mortgage Type
Purchase Money Mortgage
Purchase Details
Closed on
Mar 29, 2000
Sold by
Wike Terry L and Doughty Wike Teresa L
Bought by
Wike Terry L and Doughty Wike Teresa L
Purchase Details
Closed on
Nov 2, 1992
Bought by
Wike Terry L and Wike Teresa L
Purchase Details
Closed on
Jun 1, 1986
Create a Home Valuation Report for This Property
The Home Valuation Report is an in-depth analysis detailing your home's value as well as a comparison with similar homes in the area
Home Values in the Area
Average Home Value in this Area
Purchase History
| Date | Buyer | Sale Price | Title Company |
|---|---|---|---|
| Long Mary | $510,000 | Ohio Real Title | |
| Reichman Christopher A | $250,000 | Title First | |
| Wike Terry L | -- | -- | |
| Wike Terry L | $190,000 | -- | |
| -- | $183,000 | -- |
Source: Public Records
Mortgage History
| Date | Status | Borrower | Loan Amount |
|---|---|---|---|
| Open | Long Mary | $408,000 | |
| Previous Owner | Reichman Christopher A | $95,100 |
Source: Public Records
Tax History Compared to Growth
Tax History
| Year | Tax Paid | Tax Assessment Tax Assessment Total Assessment is a certain percentage of the fair market value that is determined by local assessors to be the total taxable value of land and additions on the property. | Land | Improvement |
|---|---|---|---|---|
| 2024 | $7,726 | $135,940 | $38,500 | $97,440 |
| 2023 | $7,332 | $131,810 | $38,500 | $93,310 |
| 2022 | $8,491 | $116,550 | $22,890 | $93,660 |
| 2021 | $8,563 | $116,550 | $22,890 | $93,660 |
| 2020 | $8,538 | $116,550 | $22,890 | $93,660 |
| 2019 | $7,475 | $96,330 | $19,080 | $77,250 |
| 2018 | $7,217 | $96,330 | $19,080 | $77,250 |
| 2017 | $7,352 | $96,330 | $19,080 | $77,250 |
| 2016 | $7,337 | $87,510 | $24,890 | $62,620 |
| 2015 | $7,106 | $87,510 | $24,890 | $62,620 |
| 2014 | $7,111 | $87,510 | $24,890 | $62,620 |
| 2013 | $3,551 | $87,500 | $24,885 | $62,615 |
Source: Public Records
Map
Nearby Homes
- 750 Autumn Branch Rd
- 737 Autumn Branch Rd
- 1209 Chatham Ridge Rd
- 1146 Forest Rise Dr
- 994 Autumn Lake Ct
- 1003 Autumn Meadows Dr
- 613 Valley Wood Ct
- 640 Brook Run Dr
- 1368 Nutmeg Ct
- 806 Watten Ln
- 800 S Spring Rd
- 5769 Burntwood Way
- 969 Farrington Dr
- 6506 Purplefinch Ct
- 1015 Swanton Ct
- 1019 Swanton Ct
- 6874 Flatlands Rd
- 6500 Cherokee Rose Dr
- 4432 Scissortail Loop
- 326 Peachtree Ct Unit 326D
- 1191 Three Forks Dr S
- 1197 Three Forks Dr S
- 1187 Three Forks Dr S
- 1205 Three Forks Dr S
- 1194 Three Forks Dr S
- 1183 Three Forks Dr S
- 1183 3 Forks Dr N
- 1211 Three Forks Dr S
- 1208 Three Forks Dr S
- 1179 Three Forks Dr S
- 1185 Broken Bow Ct
- 1193 Broken Bow Ct
- 1214 3 Forks Dr N
- 1217 Three Forks Dr S
- 1250 Autumn Park Ct
- 1201 Broken Bow Ct
- 1175 Three Forks Dr S
- 1209 Broken Bow Ct
- 1220 Three Forks Dr S
- 1223 Three Forks Dr S