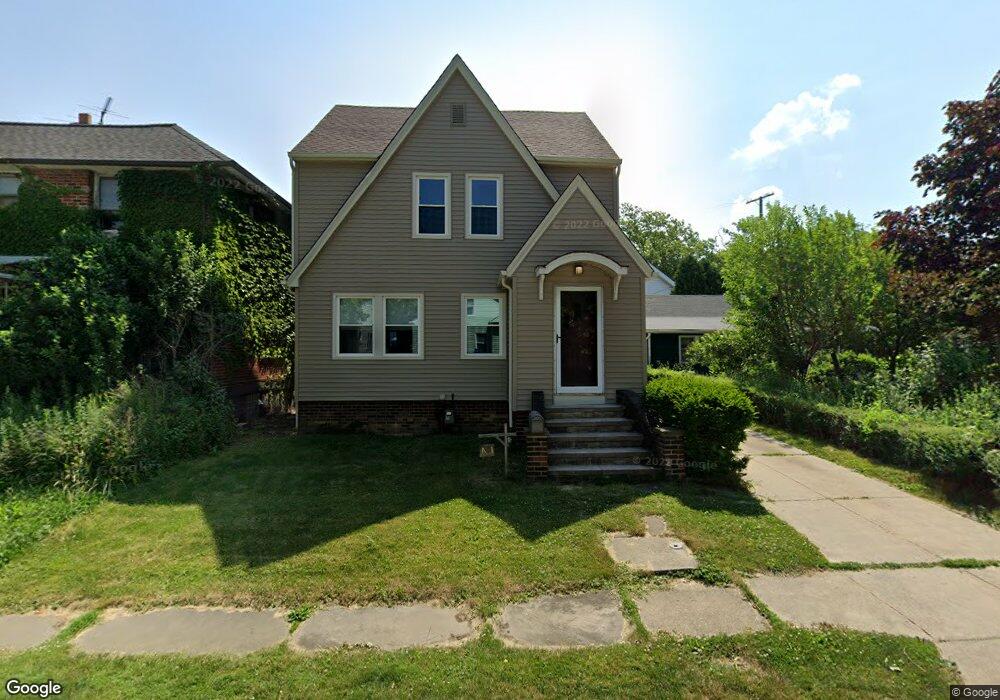
1191 E 175th St Cleveland, OH 44119
North Collinwood NeighborhoodEstimated Value: $103,666 - $126,000
3
Beds
1
Bath
1,404
Sq Ft
$84/Sq Ft
Est. Value
About This Home
This home is located at 1191 E 175th St, Cleveland, OH 44119 and is currently estimated at $117,417, approximately $83 per square foot. 1191 E 175th St is a home located in Cuyahoga County with nearby schools including Bolton, Andrew J. Rickoff School, and Adlai Stevenson School.
Ownership History
Date
Name
Owned For
Owner Type
Purchase Details
Closed on
Mar 28, 2014
Sold by
Gyorki Laura Ann
Bought by
Miller Steven A
Current Estimated Value
Purchase Details
Closed on
Nov 15, 2001
Sold by
Miller Steven A
Bought by
Miller Steven A and Miller Laura Ann Gyorki
Purchase Details
Closed on
Aug 10, 1995
Sold by
Brown Keith A
Bought by
Miller Steve A
Home Financials for this Owner
Home Financials are based on the most recent Mortgage that was taken out on this home.
Original Mortgage
$55,100
Interest Rate
7.51%
Mortgage Type
New Conventional
Purchase Details
Closed on
Sep 13, 1988
Sold by
Mahovlic Ivan J and Zamlen S M
Bought by
Brown Keith A
Purchase Details
Closed on
Jan 30, 1986
Bought by
Mahovlic Ivan J and Mahovlic Zamlen S
Purchase Details
Closed on
Aug 21, 1985
Sold by
Wilbert L Sunderman
Bought by
Sunderman Emma-Out Of Seq
Purchase Details
Closed on
Dec 18, 1979
Sold by
Sunderman Wilbert L and Sunderman Emma
Bought by
Wilbert L Sunderman
Purchase Details
Closed on
Jan 1, 1975
Bought by
Sunderman Wilbert L and Sunderman Emma
Create a Home Valuation Report for This Property
The Home Valuation Report is an in-depth analysis detailing your home's value as well as a comparison with similar homes in the area
Home Values in the Area
Average Home Value in this Area
Purchase History
| Date | Buyer | Sale Price | Title Company |
|---|---|---|---|
| Miller Steven A | -- | None Available | |
| Miller Steven A | -- | -- | |
| Miller Steve A | $58,000 | -- | |
| Brown Keith A | $24,300 | -- | |
| Mahovlic Ivan J | $10,300 | -- | |
| Sunderman Emma-Out Of Seq | -- | -- | |
| Wilbert L Sunderman | -- | -- | |
| Sunderman Wilbert L | -- | -- |
Source: Public Records
Mortgage History
| Date | Status | Borrower | Loan Amount |
|---|---|---|---|
| Previous Owner | Miller Steve A | $55,100 |
Source: Public Records
Tax History Compared to Growth
Tax History
| Year | Tax Paid | Tax Assessment Tax Assessment Total Assessment is a certain percentage of the fair market value that is determined by local assessors to be the total taxable value of land and additions on the property. | Land | Improvement |
|---|---|---|---|---|
| 2024 | $2,054 | $31,325 | $4,655 | $26,670 |
| 2023 | $1,399 | $18,450 | $3,260 | $15,190 |
| 2022 | $1,391 | $18,445 | $3,255 | $15,190 |
| 2021 | $1,377 | $18,450 | $3,260 | $15,190 |
| 2020 | $1,400 | $16,210 | $2,870 | $13,340 |
| 2019 | $1,294 | $46,300 | $8,200 | $38,100 |
| 2018 | $1,290 | $16,210 | $2,870 | $13,340 |
| 2017 | $1,247 | $15,120 | $2,730 | $12,390 |
| 2016 | $1,237 | $15,120 | $2,730 | $12,390 |
| 2015 | $1,426 | $15,120 | $2,730 | $12,390 |
| 2014 | $1,426 | $17,360 | $3,150 | $14,210 |
Source: Public Records
Map
Nearby Homes
- 1166 E 176th St
- 17216 Grovewood Ave
- 1230 E 173rd St
- 17817 Grovewood Ave
- 1113 E 177th St
- 1268 E 169th St
- 1068 E 177th St
- 1261 E 167th St
- 1040 E 177th St
- 17702 Nottingham Rd
- 1080 E 167th St
- 16215 Huntmere Ave
- 983 E 179th St
- 1363 Clearaire Rd
- 16207 Arcade Ave
- 1383 Clearaire Rd
- 17620 Saint Clair Ave
- 17639 Wildwood Ln Unit 17639
- 17633 Wildwood Ln Unit 311
- 1443 Larchmont Rd
- 1187 E 175th St
- 1183 E 175th St
- 1195 E 175th St
- 1192 E 176th St
- 1188 E 176th St
- 1196 E 176th St
- 1184 E 176th St
- 1203 E 175th St
- 1200 E 176th St
- 1190 E 175th St
- 1194 E 175th St
- 1188 E 175th St
- 1184 E 175th St
- 1180 E 176th St
- 1198 E 175th St
- 1204 E 176th St
- 17504 Grovewood Ave
- 17504 Grovewood Ave Unit 6
- 1207 E 175th St
- 1202 E 175th St