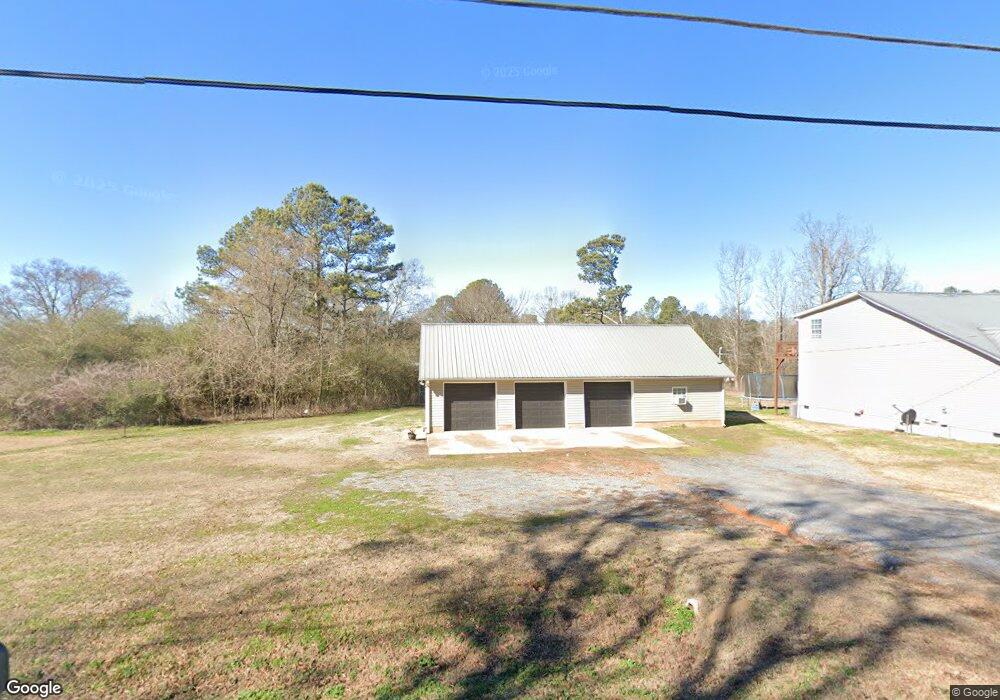
1191 Franklin Rd SW Plainville, GA 30733
Estimated Value: $245,000 - $284,522
3
Beds
2
Baths
1,150
Sq Ft
$231/Sq Ft
Est. Value
About This Home
This home is located at 1191 Franklin Rd SW, Plainville, GA 30733 and is currently estimated at $266,131, approximately $231 per square foot. 1191 Franklin Rd SW is a home located in Gordon County with nearby schools including Swain Elementary School, Ashworth Middle School, and Gordon Central High School.
Ownership History
Date
Name
Owned For
Owner Type
Purchase Details
Closed on
Jun 23, 2009
Sold by
Deutsche Bank National Trust Company
Bought by
Pfw Properties Inc
Current Estimated Value
Purchase Details
Closed on
Oct 7, 2008
Sold by
Not Provided
Bought by
Pfw Properties Inc
Purchase Details
Closed on
Aug 20, 2003
Sold by
Secretary Of Housing & Urban D
Bought by
Finch Delano
Purchase Details
Closed on
Feb 4, 2003
Sold by
Mortgage Electronic Registrati
Bought by
Secretary Of Housing & Urban Development
Purchase Details
Closed on
Feb 28, 2001
Sold by
Home Mart Builders Inc
Bought by
Hopkins Jason C
Purchase Details
Closed on
Oct 13, 2000
Sold by
Pfw Properties Inc
Bought by
Home Mart Builders Inc
Create a Home Valuation Report for This Property
The Home Valuation Report is an in-depth analysis detailing your home's value as well as a comparison with similar homes in the area
Home Values in the Area
Average Home Value in this Area
Purchase History
| Date | Buyer | Sale Price | Title Company |
|---|---|---|---|
| Pfw Properties Inc | $40,000 | -- | |
| Pfw Properties Inc | -- | -- | |
| Finch Delano | -- | -- | |
| Secretary Of Housing & Urban Development | -- | -- | |
| Mortgage Electronic Registration Sys Inc | -- | -- | |
| Hopkins Jason C | $70,000 | -- | |
| Home Mart Builders Inc | -- | -- |
Source: Public Records
Tax History Compared to Growth
Tax History
| Year | Tax Paid | Tax Assessment Tax Assessment Total Assessment is a certain percentage of the fair market value that is determined by local assessors to be the total taxable value of land and additions on the property. | Land | Improvement |
|---|---|---|---|---|
| 2024 | $2,841 | $91,920 | $4,200 | $87,720 |
| 2023 | $2,333 | $75,480 | $4,200 | $71,280 |
| 2022 | $1,543 | $57,120 | $3,360 | $53,760 |
| 2021 | $1,266 | $45,200 | $3,360 | $41,840 |
| 2020 | $1,223 | $42,680 | $3,120 | $39,560 |
| 2019 | $1,225 | $42,520 | $3,120 | $39,400 |
| 2018 | $1,166 | $40,480 | $3,120 | $37,360 |
| 2017 | $1,139 | $38,440 | $3,120 | $35,320 |
| 2016 | $1,142 | $38,440 | $3,120 | $35,320 |
| 2015 | $1,116 | $37,240 | $3,120 | $34,120 |
| 2014 | $1,090 | $37,419 | $3,150 | $34,269 |
Source: Public Records
Map
Nearby Homes
- 1211 Franklin Rd SW
- 332 Old Calhoun Rd SW
- 241 River Bend Rd SW
- 241 Riverbend Rd SW
- 154 Honeysuckle Dr SW
- 180 Honeysuckle Vine Rd
- 3610 Rome Rd SW
- 221 Hardin Rd SW
- 159 Moores Ferry Rd SW
- 3293 Rome Rd SW
- 1500 Moores Ferry Rd SW
- 0 Autry Rd SW Unit 414481
- 0 Autry Rd SW Unit 7549643
- 0 Autry Rd SW Unit 23053843
- 0 Autry Rd SW Unit 10489984
- 187 Cantrell Dr SW
- 356 W Oak Grove Rd NW
- 143 Floyd Dr SW
- 1171 Franklin Rd SW
- 133 Floyd Dr SW
- 140 Floyd Dr SW
- 1202 Franklin Rd SW
- 1159 Franklin Rd SW
- 156 Floyd Dr SW
- 126 Floyd Dr SW
- 1147 Franklin Rd SW
- 687 Plainville Rd SW
- 673 Plainville Rd SW
- 1135 Franklin Rd SW
- 707 Plainville Rd SW
- 650 Plainville Rd SW
- 1123 Franklin Rd SW
- 648 Webber Rd SW
- 674 Plainville Rd SW
- 595 Plainville Rd SW
- 640 Plainville Rd SW
- 721 Plainville Rd SW