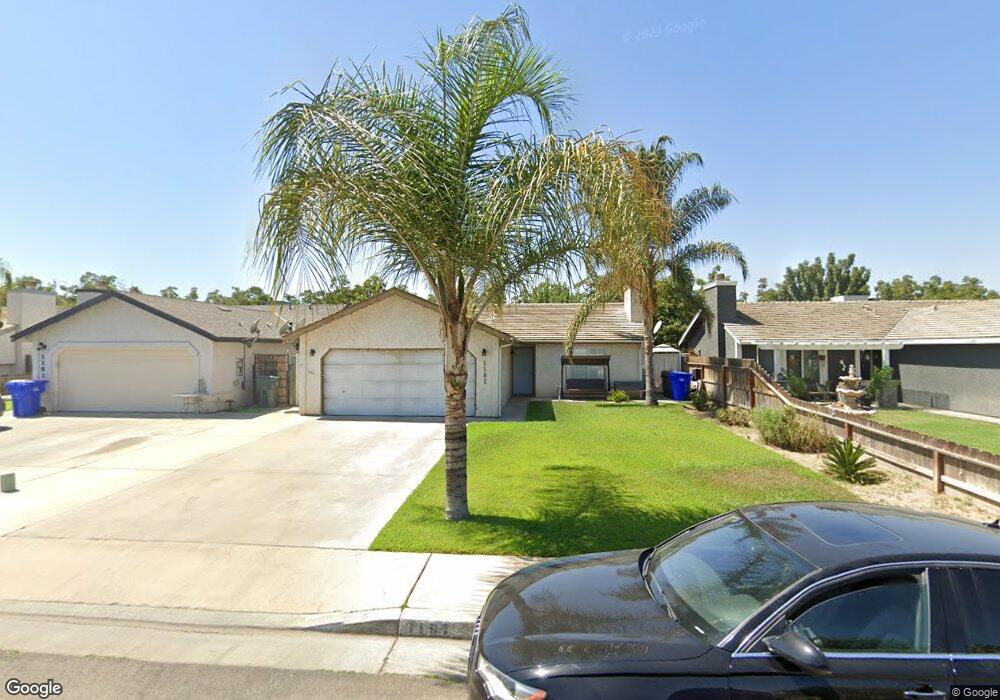
1191 N Virginia Ave Farmersville, CA 93223
Estimated Value: $278,000 - $301,000
3
Beds
3
Baths
976
Sq Ft
$296/Sq Ft
Est. Value
About This Home
This home is located at 1191 N Virginia Ave, Farmersville, CA 93223 and is currently estimated at $288,530, approximately $295 per square foot. 1191 N Virginia Ave is a home located in Tulare County with nearby schools including Freedom Elementary School, J.E. Hester Elementary School, and George L. Snowden Elementary School.
Ownership History
Date
Name
Owned For
Owner Type
Purchase Details
Closed on
Jun 15, 1998
Sold by
Chase Manhattan Mtg Corp
Bought by
Berber Delfino and Casas Petra
Current Estimated Value
Home Financials for this Owner
Home Financials are based on the most recent Mortgage that was taken out on this home.
Original Mortgage
$75,409
Interest Rate
7.06%
Mortgage Type
FHA
Purchase Details
Closed on
Jan 14, 1998
Sold by
Rios Phillip L
Bought by
Chase Manhattan Mtg Corp
Purchase Details
Closed on
Jul 1, 1997
Sold by
Rios Phillip L
Bought by
Ortega Angela
Purchase Details
Closed on
Mar 28, 1995
Sold by
The Donald Lawrence Fulbright Co Inc
Bought by
Rios Phillip L and Ortega Angela
Home Financials for this Owner
Home Financials are based on the most recent Mortgage that was taken out on this home.
Original Mortgage
$73,440
Interest Rate
8.51%
Create a Home Valuation Report for This Property
The Home Valuation Report is an in-depth analysis detailing your home's value as well as a comparison with similar homes in the area
Home Values in the Area
Average Home Value in this Area
Purchase History
| Date | Buyer | Sale Price | Title Company |
|---|---|---|---|
| Berber Delfino | $75,500 | Fidelity National Title Co | |
| Chase Manhattan Mtg Corp | $78,322 | First American Title Ins Co | |
| Ortega Angela | -- | -- | |
| Rios Phillip L | $73,500 | Fidelity National Title |
Source: Public Records
Mortgage History
| Date | Status | Borrower | Loan Amount |
|---|---|---|---|
| Previous Owner | Berber Delfino | $75,409 | |
| Previous Owner | Rios Phillip L | $73,440 |
Source: Public Records
Tax History Compared to Growth
Tax History
| Year | Tax Paid | Tax Assessment Tax Assessment Total Assessment is a certain percentage of the fair market value that is determined by local assessors to be the total taxable value of land and additions on the property. | Land | Improvement |
|---|---|---|---|---|
| 2025 | $1,349 | $118,368 | $39,193 | $79,175 |
| 2024 | $1,349 | $116,048 | $38,425 | $77,623 |
| 2023 | $1,354 | $113,773 | $37,672 | $76,101 |
| 2022 | $1,257 | $111,543 | $36,934 | $74,609 |
| 2021 | $1,235 | $109,356 | $36,210 | $73,146 |
| 2020 | $1,222 | $108,235 | $35,839 | $72,396 |
| 2019 | $1,237 | $106,112 | $35,136 | $70,976 |
| 2018 | $1,202 | $104,031 | $34,447 | $69,584 |
| 2017 | $1,217 | $101,992 | $33,772 | $68,220 |
| 2016 | $1,152 | $99,992 | $33,110 | $66,882 |
| 2015 | $975 | $98,490 | $32,613 | $65,877 |
| 2014 | $975 | $85,000 | $21,000 | $64,000 |
Source: Public Records
Map
Nearby Homes
- 896 N Mariposa Ave
- 0 Apn 128-030-056-000 Unit 218742
- 1643 Tehama Ave
- 0 Avenue 288
- 0 S Farmersville Blvd Unit 238390
- 896 Farmersville Rd
- 701 Farmersville Rd
- 188 E Citrus Dr
- 322 E Citrus Dr
- 391 Teddy St
- 438 N Magnolia Ave
- 0 Avenue 288
- 209 S Magnolia Ave
- 327 S Farmersville Blvd
- 680 E Larry St
- 738 E Larry St
- 245 W Oakland St
- 885 E Ash St
- 903 E Ash St
- 732 N Dwight Ave
- 1201 N Virginia Ave
- 1181 N Virginia Ave
- 1171 N Virginia Ave
- 1211 N Virginia Ave
- 1231 N Virginia Ave
- 1161 N Virginia Ave
- 1192 N Virginia Ave
- 1182 N Virginia Ave
- 1202 N Virginia Ave
- 1251 N Virginia Ave
- 1151 N Virginia Ave
- 1172 N Virginia Ave
- 1212 N Virginia Ave
- 1271 N Virginia Ave
- 1131 N Virginia Ave
- 1232 N Virginia Ave
- 856 W Rita St
- 1205 N June Ct
- 1132 N Virginia Ave
- 885 W Rita St