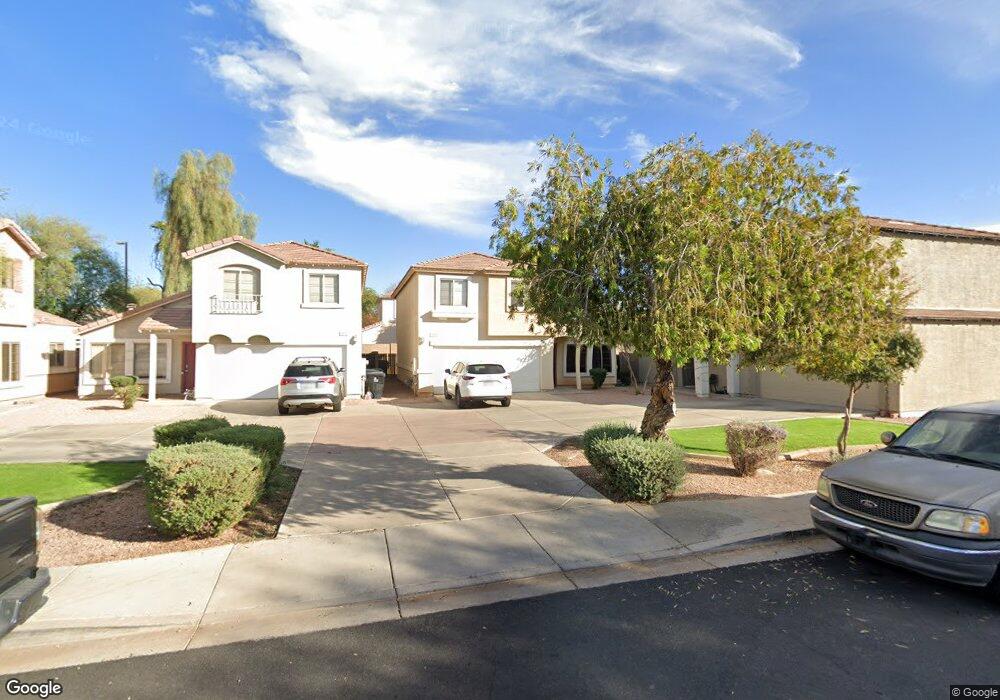
1191 S Boulder St Unit 19D Gilbert, AZ 85296
East Gilbert NeighborhoodEstimated Value: $414,379 - $458,000
Studio
3
Baths
1,661
Sq Ft
$262/Sq Ft
Est. Value
About This Home
This home is located at 1191 S Boulder St Unit 19D, Gilbert, AZ 85296 and is currently estimated at $434,845, approximately $261 per square foot. 1191 S Boulder St Unit 19D is a home located in Maricopa County with nearby schools including Mesquite Elementary School, South Valley Jr. High School, and Campo Verde High School.
Ownership History
Date
Name
Owned For
Owner Type
Purchase Details
Closed on
Jul 6, 2005
Sold by
Wall Joan Lee
Bought by
Wallace James Q and Wallace Shani M
Current Estimated Value
Home Financials for this Owner
Home Financials are based on the most recent Mortgage that was taken out on this home.
Original Mortgage
$140,000
Outstanding Balance
$72,704
Interest Rate
5.58%
Mortgage Type
Fannie Mae Freddie Mac
Estimated Equity
$362,141
Purchase Details
Closed on
Jan 13, 1998
Sold by
Key Construction Inc
Bought by
Wallace James Q and Wallace Shani M
Home Financials for this Owner
Home Financials are based on the most recent Mortgage that was taken out on this home.
Original Mortgage
$111,503
Interest Rate
7.13%
Mortgage Type
FHA
Create a Home Valuation Report for This Property
The Home Valuation Report is an in-depth analysis detailing your home's value as well as a comparison with similar homes in the area
Home Values in the Area
Average Home Value in this Area
Purchase History
| Date | Buyer | Sale Price | Title Company |
|---|---|---|---|
| Wallace James Q | -- | -- | |
| Wallace James Q | $112,243 | Chicago Title Insurance Co |
Source: Public Records
Mortgage History
| Date | Status | Borrower | Loan Amount |
|---|---|---|---|
| Open | Wallace James Q | $140,000 | |
| Previous Owner | Wallace James Q | $111,503 |
Source: Public Records
Tax History
| Year | Tax Paid | Tax Assessment Tax Assessment Total Assessment is a certain percentage of the fair market value that is determined by local assessors to be the total taxable value of land and additions on the property. | Land | Improvement |
|---|---|---|---|---|
| 2025 | $1,243 | $16,330 | -- | -- |
| 2024 | $1,204 | $15,553 | -- | -- |
| 2023 | $1,204 | $30,510 | $6,100 | $24,410 |
| 2022 | $1,168 | $22,710 | $4,540 | $18,170 |
| 2021 | $1,233 | $21,460 | $4,290 | $17,170 |
| 2020 | $1,214 | $19,430 | $3,880 | $15,550 |
| 2019 | $1,116 | $17,700 | $3,540 | $14,160 |
| 2018 | $1,082 | $16,630 | $3,320 | $13,310 |
| 2017 | $1,045 | $15,250 | $3,050 | $12,200 |
| 2016 | $1,077 | $14,520 | $2,900 | $11,620 |
| 2015 | $986 | $13,260 | $2,650 | $10,610 |
Source: Public Records
Map
Nearby Homes
- 1576 E Jasper Ct Unit E
- 1190 S Red Rock Ct Unit D
- 1187 S Val Vista Dr
- 1580 E Sherri Dr Unit E
- 1561 E Black Diamond Dr
- 1456 S Boulder St Unit B
- 1480 S Boulder St Unit B
- 1021 S Western Skies Dr
- 1365 E Betsy Ln
- 1355 E Betsy Ln
- 1102 S Sandstone St
- 1476 E Shannon St
- 1136 E San Tan Dr
- 1518 S Fern Dr
- 1762 S Rome St
- 2056 E San Tan Ct
- 652 S Bahama Dr
- 1915 E Oxford Ln
- 1648 E Palomino Dr
- 1015 E Liberty Ln
- 1191 S Boulder St
- 1191 S Boulder St Unit A
- 1191 S Boulder St Unit WOW
- 1191 S Boulder St Unit C
- 1191 S Boulder St Unit 19B
- 1191 S Boulder St Unit 19C
- 1191 S Boulder St Unit 19A
- 1191 S Boulder St
- 1191 S Boulder St Unit B
- 1213 S Boulder St Unit A
- 1213 S Boulder St Unit 18B
- 1213 S Boulder St Unit 18A
- 1213 S Boulder St Unit 18C
- 1213 S Boulder St Unit 18D
- 1213 S Boulder St Unit C
- 1576 E Jasper Ct Unit F17
- 1576 E Jasper Ct Unit A17
- 1576 E Jasper Ct Unit F
- 1576 E Jasper Ct Unit C
- 1576 E Jasper Ct Unit B
Your Personal Tour Guide
Ask me questions while you tour the home.