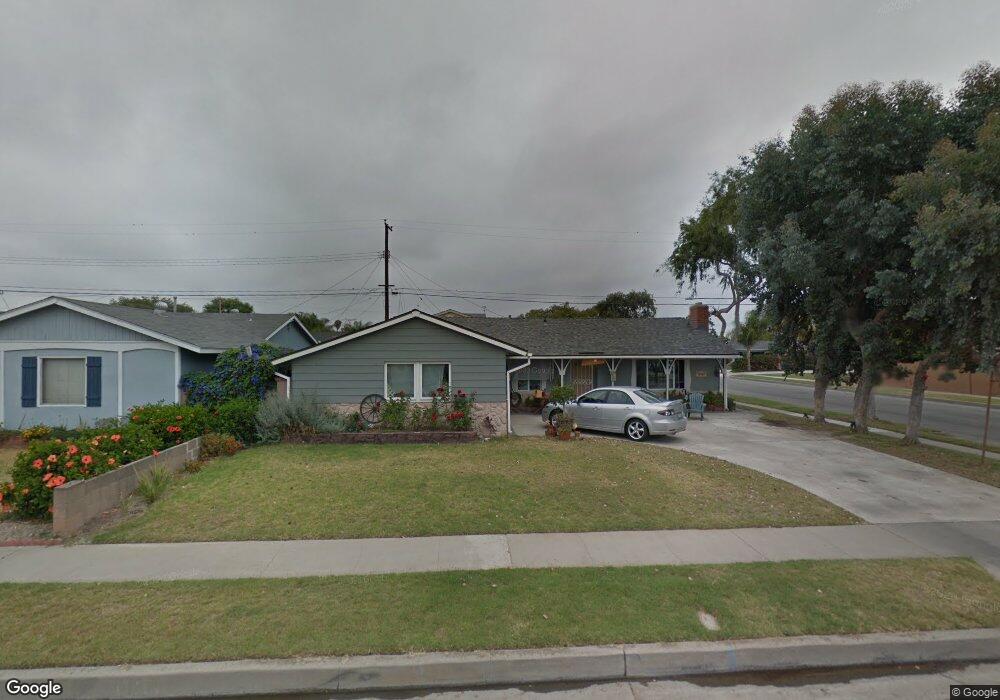
11912 Emerald St Garden Grove, CA 92845
West Garden Grove NeighborhoodEstimated Value: $995,000 - $1,158,000
3
Beds
2
Baths
1,213
Sq Ft
$869/Sq Ft
Est. Value
About This Home
This home is located at 11912 Emerald St, Garden Grove, CA 92845 and is currently estimated at $1,053,675, approximately $868 per square foot. 11912 Emerald St is a home located in Orange County with nearby schools including Patton Elementary School, Hilton D. Bell Intermediate School, and Pacifica High School.
Ownership History
Date
Name
Owned For
Owner Type
Purchase Details
Closed on
Dec 10, 2012
Sold by
Lundblad Robert C and Lundblad Karen T
Bought by
Lundblad Robert C and Lundblad Karen T
Current Estimated Value
Home Financials for this Owner
Home Financials are based on the most recent Mortgage that was taken out on this home.
Original Mortgage
$277,000
Outstanding Balance
$50,903
Interest Rate
3.35%
Mortgage Type
New Conventional
Estimated Equity
$1,002,772
Purchase Details
Closed on
May 20, 2005
Sold by
Lundblad Robert C and Lundblad Karen T
Bought by
Lundblad Robert C and Lundblad Karen T
Purchase Details
Closed on
Aug 29, 1995
Sold by
Hewitt Virgil L and Hewitt Karen R
Bought by
Hewitt Virgil L and Hewitt Karen R
Purchase Details
Closed on
Jun 13, 1995
Sold by
Hewitt Virgil L and Hewitt Karen R
Bought by
Lundblad Robert C and Lundblad Karen T
Home Financials for this Owner
Home Financials are based on the most recent Mortgage that was taken out on this home.
Original Mortgage
$166,400
Interest Rate
8.33%
Create a Home Valuation Report for This Property
The Home Valuation Report is an in-depth analysis detailing your home's value as well as a comparison with similar homes in the area
Home Values in the Area
Average Home Value in this Area
Purchase History
| Date | Buyer | Sale Price | Title Company |
|---|---|---|---|
| Lundblad Robert C | -- | Accommodation | |
| Lundblad Robert C | -- | Title365 Company | |
| Lundblad Robert C | -- | -- | |
| Hewitt Virgil L | -- | -- | |
| Lundblad Robert C | $208,000 | California Counties Title Co |
Source: Public Records
Mortgage History
| Date | Status | Borrower | Loan Amount |
|---|---|---|---|
| Open | Lundblad Robert C | $277,000 | |
| Previous Owner | Lundblad Robert C | $166,400 |
Source: Public Records
Tax History Compared to Growth
Tax History
| Year | Tax Paid | Tax Assessment Tax Assessment Total Assessment is a certain percentage of the fair market value that is determined by local assessors to be the total taxable value of land and additions on the property. | Land | Improvement |
|---|---|---|---|---|
| 2025 | $4,567 | $338,759 | $244,336 | $94,423 |
| 2024 | $4,567 | $332,117 | $239,545 | $92,572 |
| 2023 | $4,469 | $325,605 | $234,848 | $90,757 |
| 2022 | $4,387 | $319,221 | $230,243 | $88,978 |
| 2021 | $4,339 | $312,962 | $225,728 | $87,234 |
| 2020 | $4,290 | $309,753 | $223,413 | $86,340 |
| 2019 | $4,152 | $303,680 | $219,032 | $84,648 |
| 2018 | $4,079 | $297,726 | $214,737 | $82,989 |
| 2017 | $4,017 | $291,889 | $210,527 | $81,362 |
| 2016 | $3,828 | $286,166 | $206,399 | $79,767 |
| 2015 | $3,776 | $281,868 | $203,299 | $78,569 |
| 2014 | $3,655 | $276,347 | $199,317 | $77,030 |
Source: Public Records
Map
Nearby Homes
- 6212 Santa Rita Ave
- 6056 Palau St
- 5902 Belgrave Ave
- 11901 Saint Mark St
- 6631 Chapman Ave
- 5832 Ludlow Ave
- 11676 Lakia Dr
- 12202 Wutzke St
- 11580 Panay St
- 6061 Killarney Ave
- 5633 Lakia Dr
- 11781 Lamplighter St
- 6414 Anguilla Ave
- 6801 Chapman Ave
- 11474 Shippigan Way
- 6861 Reefton Ave
- 12581 George Reyburn Rd
- 12586 George Reyburn Rd
- 6906 Molokai Dr
- 11390 Nantucket Ct
- 11902 Emerald St
- 11911 Turquoise St
- 11901 Turquoise St
- 11892 Emerald St
- 11932 Emerald St
- 11901 Emerald St
- 11881 Turquoise St
- 6142 Santa Rita Ave
- 11911 Emerald St
- 11891 Emerald St
- 11882 Emerald St
- 11952 Emerald St
- 11931 Emerald St
- 6162 Santa Rita Ave
- 11871 Turquoise St
- 11881 Emerald St
- 11941 Emerald St
- 6171 Santa Rita Ave
- 11872 Emerald St
- 6172 Santa Rita Ave