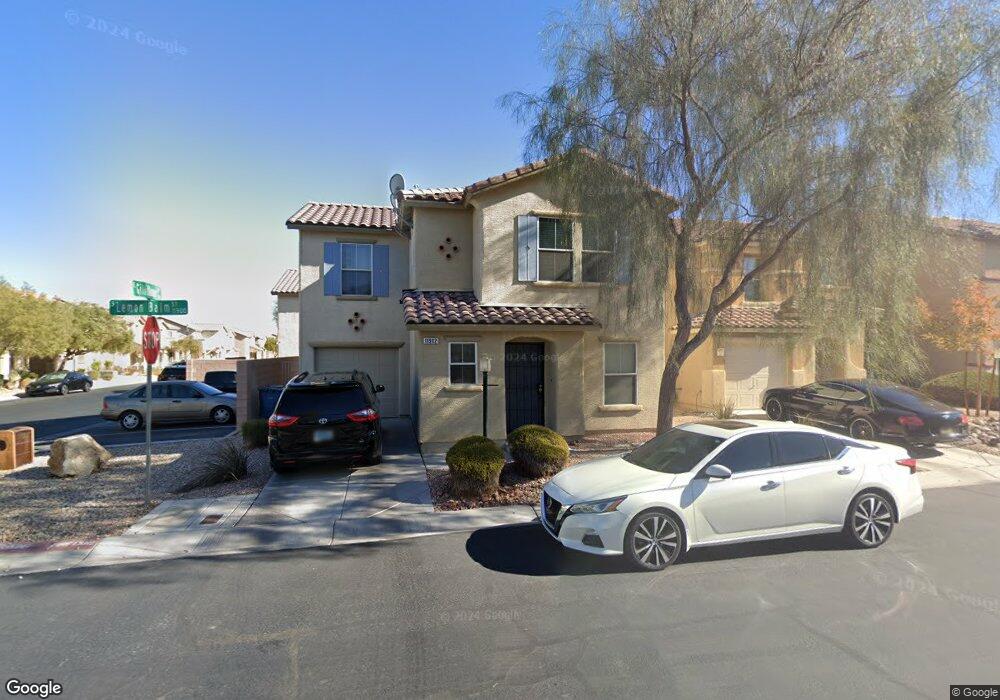
11912 Lemon Balm St Unit 3 Las Vegas, NV 89183
Silverado Ranch NeighborhoodEstimated Value: $367,000 - $378,000
3
Beds
3
Baths
1,480
Sq Ft
$252/Sq Ft
Est. Value
About This Home
This home is located at 11912 Lemon Balm St Unit 3, Las Vegas, NV 89183 and is currently estimated at $373,022, approximately $252 per square foot. 11912 Lemon Balm St Unit 3 is a home located in Clark County with nearby schools including Steve Schorr Elementary School, Del E. Webb Middle School, and Liberty High School.
Ownership History
Date
Name
Owned For
Owner Type
Purchase Details
Closed on
Nov 4, 2011
Sold by
Fannie Mae
Bought by
Briones Imee D and Gray James A
Current Estimated Value
Home Financials for this Owner
Home Financials are based on the most recent Mortgage that was taken out on this home.
Original Mortgage
$101,682
Outstanding Balance
$74,088
Interest Rate
5.5%
Mortgage Type
FHA
Estimated Equity
$298,934
Purchase Details
Closed on
Aug 2, 2011
Sold by
Haydocy Donna J
Bought by
Federal National Mortgage Association
Purchase Details
Closed on
Apr 13, 2005
Sold by
Kb Home Nevada Inc
Bought by
Haydocy Donna J
Home Financials for this Owner
Home Financials are based on the most recent Mortgage that was taken out on this home.
Original Mortgage
$195,700
Interest Rate
5.25%
Mortgage Type
Unknown
Create a Home Valuation Report for This Property
The Home Valuation Report is an in-depth analysis detailing your home's value as well as a comparison with similar homes in the area
Home Values in the Area
Average Home Value in this Area
Purchase History
| Date | Buyer | Sale Price | Title Company |
|---|---|---|---|
| Briones Imee D | $104,328 | Stewart Title Las Vegas War | |
| Federal National Mortgage Association | $187,479 | Accommodation | |
| Haydocy Donna J | $244,661 | First Amer Title Co Of Nv |
Source: Public Records
Mortgage History
| Date | Status | Borrower | Loan Amount |
|---|---|---|---|
| Open | Briones Imee D | $101,682 | |
| Previous Owner | Haydocy Donna J | $195,700 |
Source: Public Records
Tax History Compared to Growth
Tax History
| Year | Tax Paid | Tax Assessment Tax Assessment Total Assessment is a certain percentage of the fair market value that is determined by local assessors to be the total taxable value of land and additions on the property. | Land | Improvement |
|---|---|---|---|---|
| 2025 | $1,277 | $98,082 | $35,000 | $63,082 |
| 2024 | $1,240 | $98,082 | $35,000 | $63,082 |
| 2023 | $1,012 | $89,518 | $30,100 | $59,418 |
| 2022 | $1,204 | $77,633 | $23,450 | $54,183 |
| 2021 | $1,169 | $73,542 | $22,050 | $51,492 |
| 2020 | $1,132 | $73,052 | $22,050 | $51,002 |
| 2019 | $1,099 | $68,643 | $18,550 | $50,093 |
| 2018 | $1,067 | $62,684 | $14,700 | $47,984 |
| 2017 | $1,379 | $62,211 | $13,650 | $48,561 |
| 2016 | $1,012 | $52,549 | $10,150 | $42,399 |
| 2015 | $1,009 | $38,892 | $8,050 | $30,842 |
| 2014 | $979 | $32,397 | $3,500 | $28,897 |
Source: Public Records
Map
Nearby Homes
- 11862 Partenio Ct
- 11934 Wild Chamomile St
- 104 Masserta Ct
- 11953 Haven St
- 11819 Bella Luna St
- 11769 Elianto St
- 11771 Bergamo Ct
- 11746 Magliana St
- 144 Bella Milano Ave
- 11894 Snow Bank St
- 11882 Snow Bank St
- 218 Lantana Breeze Dr
- 57 Foxworth Ct
- 72 Dark Creek Ave
- 25 Barbara Ln Unit 80
- 25 Barbara Ln Unit 53
- 25 Barbara Ln Unit 62
- 25 Barbara Ln Unit 26
- 68 Jewel Mine Ave
- 180 Bowes Ave
- 11918 Lemon Balm St
- 11907 Jersey Lilly St
- 11913 Jersey Lilly St
- 11924 Lemon Balm St
- 137 Gilliflower Ave
- 11930 Lemon Balm St
- 11925 Jersey Lilly St
- 140 Wild Candlenut Ct
- 146 Gilliflower Ave Unit 3
- 148 Gilliflower Ave
- 142 Gilliflower Ave
- 135 Gilliflower Ave
- 138 Wild Candlenut Ct
- 138 Gilliflower Ave
- 11936 Lemon Balm St
- 156 Gilliflower Ave Unit 3
- 133 Gilliflower Ave
- 11908 Jersey Lilly St
- 136 Gilliflower Ave