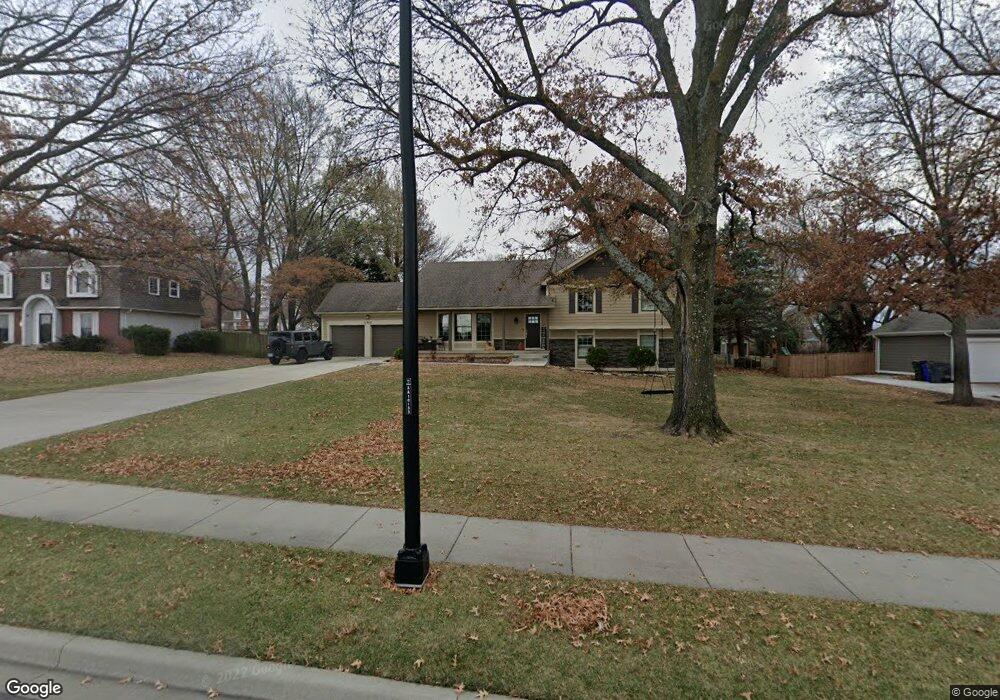
11915 W 143rd St Olathe, KS 66062
Estimated Value: $419,490 - $458,000
5
Beds
4
Baths
2,010
Sq Ft
$221/Sq Ft
Est. Value
About This Home
This home is located at 11915 W 143rd St, Olathe, KS 66062 and is currently estimated at $444,373, approximately $221 per square foot. 11915 W 143rd St is a home located in Johnson County with nearby schools including Morse Elementary School, Aubry Bend Middle School, and Blue Valley Southwest High School.
Ownership History
Date
Name
Owned For
Owner Type
Purchase Details
Closed on
Jul 30, 2020
Sold by
Hammett Reece
Bought by
Hammett Jason and Hammett Haley
Current Estimated Value
Home Financials for this Owner
Home Financials are based on the most recent Mortgage that was taken out on this home.
Original Mortgage
$296,000
Outstanding Balance
$203,034
Interest Rate
3.1%
Mortgage Type
New Conventional
Estimated Equity
$241,339
Purchase Details
Closed on
Jun 7, 2018
Sold by
Carver Janna S
Bought by
Hemmett Reece
Purchase Details
Closed on
Dec 27, 2005
Sold by
Bocquin Daniel K and Bocquin Angela L
Bought by
Carver John A and Carver Janna S
Home Financials for this Owner
Home Financials are based on the most recent Mortgage that was taken out on this home.
Original Mortgage
$28,800
Interest Rate
6.2%
Mortgage Type
Credit Line Revolving
Create a Home Valuation Report for This Property
The Home Valuation Report is an in-depth analysis detailing your home's value as well as a comparison with similar homes in the area
Home Values in the Area
Average Home Value in this Area
Purchase History
| Date | Buyer | Sale Price | Title Company |
|---|---|---|---|
| Hammett Jason | -- | Kansas City Title Inc | |
| Hemmett Reece | -- | None Available | |
| Carver John A | -- | Kansas City Title |
Source: Public Records
Mortgage History
| Date | Status | Borrower | Loan Amount |
|---|---|---|---|
| Open | Hammett Jason | $296,000 | |
| Previous Owner | Carver John A | $28,800 | |
| Previous Owner | Carver John A | $153,600 |
Source: Public Records
Tax History
| Year | Tax Paid | Tax Assessment Tax Assessment Total Assessment is a certain percentage of the fair market value that is determined by local assessors to be the total taxable value of land and additions on the property. | Land | Improvement |
|---|---|---|---|---|
| 2025 | $3,467 | $37,685 | $5,176 | $32,509 |
| 2024 | $3,467 | $33,177 | $5,176 | $28,001 |
| 2023 | $3,755 | $34,937 | $5,176 | $29,761 |
| 2022 | $3,609 | $32,752 | $4,717 | $28,035 |
| 2021 | $3,450 | $29,647 | $4,717 | $24,930 |
| 2020 | $3,276 | $27,749 | $4,717 | $23,032 |
| 2019 | $3,226 | $26,783 | $4,717 | $22,066 |
| 2018 | $3,308 | $26,944 | $4,718 | $22,226 |
| 2017 | $3,011 | $24,081 | $4,286 | $19,795 |
| 2016 | $2,857 | $22,885 | $3,905 | $18,980 |
| 2015 | $2,698 | $21,367 | $3,905 | $17,462 |
| 2013 | -- | $19,860 | $3,905 | $15,955 |
Source: Public Records
Map
Nearby Homes
- 14399 S Parkhill St
- 14645 S Caenen Ln
- 14200 Rosehill
- 13849 Westgate St
- 13841 Westgate St
- 13833 Westgate St
- 13837 Westgate St
- 13825 Westgate St
- 13853 Westgate St
- 14157 Bond St
- 13845 Westgate St
- 11519 W 144th Place
- 14301 Bond St
- 12715 W 146th St
- 14116 Richards St
- 11308 W 143rd Terrace
- 14009 Lucille St
- 14347 Flint St
- 14686 S Parkhill St
- 12609 138th Place
- 11913 W 143rd St
- 11917 W 143rd St
- 11912 W 143rd Terrace
- 11914 W 143rd Terrace
- 11911 W 143rd St
- 11919 W 143rd St
- 11910 W 143rd Terrace
- 11909 W 143rd St
- 12403 W 143rd St
- 11908 W 143rd Terrace
- 11915 W 143rd Terrace
- 11913 W 143rd Terrace
- 11911 W 143rd Terrace
- 11906 W 143rd Terrace
- 11909 W 143rd Terrace
- 11905 W 143rd St
- 11907 W 143rd Terrace
- 12673 W 143rd St
- 11904 W 143rd Terrace
- 11905 W 143rd Terrace
Your Personal Tour Guide
Ask me questions while you tour the home.