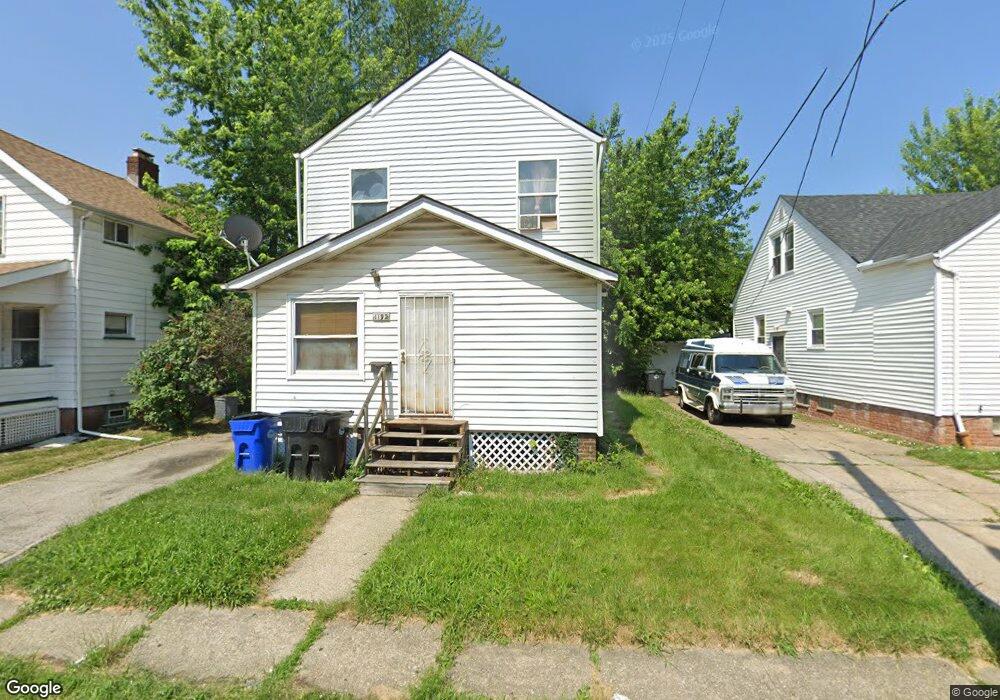
1192 E 173rd St Cleveland, OH 44119
North Collinwood NeighborhoodEstimated Value: $85,906 - $143,000
1
Bed
1
Bath
1,200
Sq Ft
$93/Sq Ft
Est. Value
About This Home
This home is located at 1192 E 173rd St, Cleveland, OH 44119 and is currently estimated at $111,227, approximately $92 per square foot. 1192 E 173rd St is a home located in Cuyahoga County with nearby schools including Lakeshore Intergenerational School, Imagine Bella Academy of Excellence, and St. Jerome Elementary School.
Ownership History
Date
Name
Owned For
Owner Type
Purchase Details
Closed on
Oct 18, 2000
Sold by
Cresthaven Development Inc
Bought by
Jones Tracey L
Current Estimated Value
Home Financials for this Owner
Home Financials are based on the most recent Mortgage that was taken out on this home.
Original Mortgage
$82,400
Outstanding Balance
$29,943
Interest Rate
7.87%
Estimated Equity
$81,284
Purchase Details
Closed on
Oct 2, 2000
Sold by
Gardner Christopher G
Bought by
Cresthaven Development
Home Financials for this Owner
Home Financials are based on the most recent Mortgage that was taken out on this home.
Original Mortgage
$82,400
Outstanding Balance
$29,943
Interest Rate
7.87%
Estimated Equity
$81,284
Purchase Details
Closed on
Aug 18, 1997
Sold by
Fuller James F
Bought by
Gardiner Christopher
Purchase Details
Closed on
May 4, 1978
Sold by
Muzinich Mary
Bought by
Fuller James F
Purchase Details
Closed on
Jan 1, 1975
Bought by
Muzinich Mary
Create a Home Valuation Report for This Property
The Home Valuation Report is an in-depth analysis detailing your home's value as well as a comparison with similar homes in the area
Home Values in the Area
Average Home Value in this Area
Purchase History
| Date | Buyer | Sale Price | Title Company |
|---|---|---|---|
| Jones Tracey L | $92,000 | -- | |
| Cresthaven Development | $41,000 | -- | |
| Gardiner Christopher | $35,000 | -- | |
| Fuller James F | $19,500 | -- | |
| Muzinich Mary | -- | -- |
Source: Public Records
Mortgage History
| Date | Status | Borrower | Loan Amount |
|---|---|---|---|
| Open | Jones Tracey L | $82,400 | |
| Closed | Gardiner Christopher | -- | |
| Closed | Jones Tracey L | $10,000 |
Source: Public Records
Tax History
| Year | Tax Paid | Tax Assessment Tax Assessment Total Assessment is a certain percentage of the fair market value that is determined by local assessors to be the total taxable value of land and additions on the property. | Land | Improvement |
|---|---|---|---|---|
| 2024 | $1,864 | $28,420 | $5,145 | $23,275 |
| 2023 | $1,418 | $18,690 | $3,640 | $15,050 |
| 2022 | $1,410 | $18,690 | $3,640 | $15,050 |
| 2021 | $1,395 | $18,690 | $3,640 | $15,050 |
| 2020 | $1,415 | $16,380 | $3,190 | $13,200 |
| 2019 | $1,309 | $46,800 | $9,100 | $37,700 |
| 2018 | $1,304 | $16,380 | $3,190 | $13,200 |
| 2017 | $1,596 | $19,360 | $3,010 | $16,350 |
| 2016 | $1,584 | $19,360 | $3,010 | $16,350 |
| 2015 | $8,436 | $19,360 | $3,010 | $16,350 |
| 2014 | $8,436 | $22,270 | $3,470 | $18,800 |
Source: Public Records
Map
Nearby Homes
- 1193 E 172nd St
- 17216 Grovewood Ave
- 1241 E 173rd St
- 16918 Grovewood Ave
- 1239 E 168th St
- 1261 E 167th St
- 1113 E 177th St
- 1077 E 169th St
- 16204 Arcade Ave
- 16110 Huntmere Ave
- 983 E 179th St
- 15831 Trafalgar Ave
- 15901 Pythias Ave
- 17633 Wildwood Ln Unit 311
- 17639 Wildwood Ln Unit 17639
- 1387 Clearaire Rd
- 1357 E 170th St
- 1290 E 188th St
- 18526 Underwood Ave
- 1476 Clermont Rd
- 1196 E 173rd St
- 1188 E 173rd St
- 1200 E 173rd St
- 1189 E 172nd St
- 1185 E 172nd St
- 1197 E 172nd St
- 1204 E 173rd St
- 1204 E 173rd St Unit UP
- 1204 E 173rd St Unit down
- 1193 E 173rd St
- 17210 Grovewood Ave
- 1201 E 172nd St
- 1175 E 173rd St
- 1187 E 173rd St
- 1201 E 173rd St
- 17206 Grovewood Ave
- 1208 E 173rd St
- 1181 E 173rd St
- 1205 E 173rd St
- 1179 E 173rd St
Your Personal Tour Guide
Ask me questions while you tour the home.