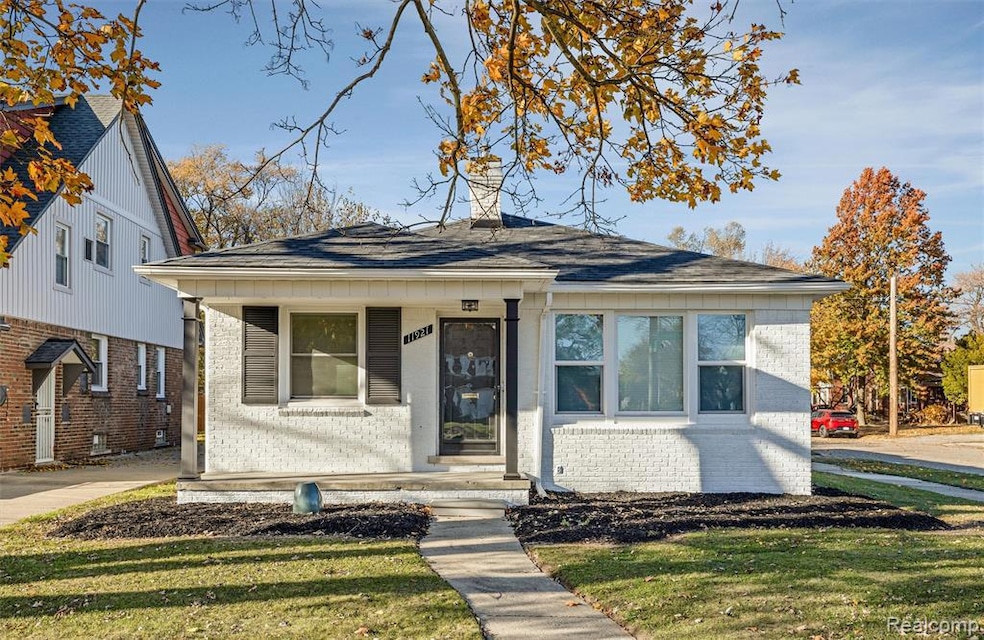
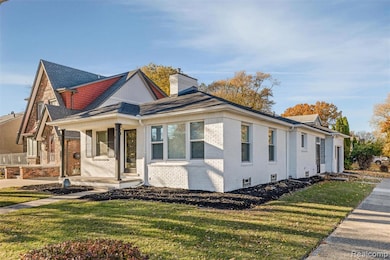
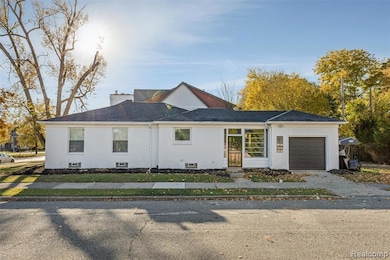
11921 E Outer Dr Detroit, MI 48224
Morningside NeighborhoodEstimated payment $1,092/month
Highlights
- Ranch Style House
- Ground Level Unit
- Stainless Steel Appliances
- Cass Technical High School Rated 10
- No HOA
- 1 Car Attached Garage
About This Home
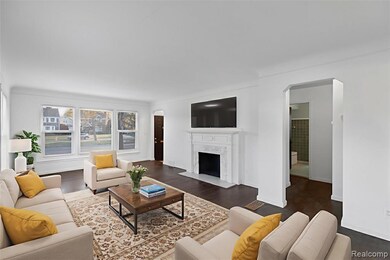
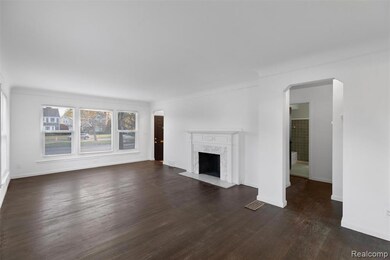
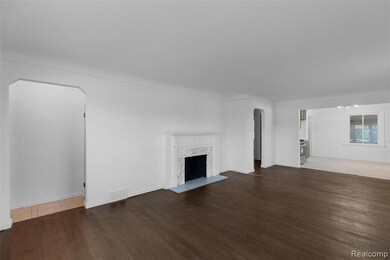
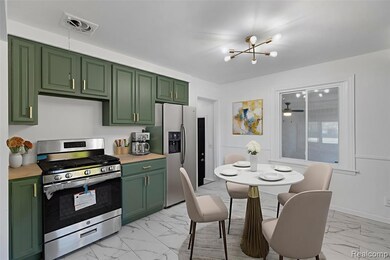
Welcome to 11921 E Outer Drive! This beautiful two bedroom home has been completely updated and remodeled throughout. Entering through the front door, the spacious living room awaits, offering a warm and comfortable atmosphere with its beautiful fireplace, perfect for relaxing evenings. The open floor plan leads directly into the gorgeous kitchen featuring shaker cabinets, butcher block countertops and modernized fixtures providing a blend of style and functionality for your culinary adventures. The classic tiled bathroom has been updated with new fixtures and vanity. Hate those cold winters? With the attached garage you can enter through the breezeway. The breezeway is large enough to be used as a seating area, home office or even storage. The basement has been finished with plenty of room to entertain and offers a second bathroom. Do not hesitate on this one!
Home Details
Home Type
- Single Family
Est. Annual Taxes
Year Built
- Built in 1951 | Remodeled in 2025
Lot Details
- 4,792 Sq Ft Lot
- Lot Dimensions are 44 x 114
Parking
- 1 Car Attached Garage
Home Design
- Ranch Style House
- Brick Exterior Construction
- Block Foundation
- Asphalt Roof
Interior Spaces
- 1,110 Sq Ft Home
- Living Room with Fireplace
- Partially Finished Basement
Kitchen
- Free-Standing Gas Range
- Dishwasher
- Stainless Steel Appliances
Bedrooms and Bathrooms
- 2 Bedrooms
Location
- Ground Level Unit
Utilities
- Forced Air Heating System
- Heating System Uses Natural Gas
- Natural Gas Water Heater
- Sewer in Street
Community Details
- No Home Owners Association
- A M Campaus Three Mile Drive Add Subdivision
Listing and Financial Details
- Assessor Parcel Number W21I080544S
Map
Home Values in the Area
Average Home Value in this Area
Tax History
| Year | Tax Paid | Tax Assessment Tax Assessment Total Assessment is a certain percentage of the fair market value that is determined by local assessors to be the total taxable value of land and additions on the property. | Land | Improvement |
|---|---|---|---|---|
| 2025 | $2,557 | $44,700 | $0 | $0 |
| 2024 | $2,528 | $36,700 | $0 | $0 |
| 2023 | $2,457 | $28,800 | $0 | $0 |
| 2022 | $2,723 | $28,400 | $0 | $0 |
| 2021 | $1,773 | $22,700 | $0 | $0 |
| 2020 | $1,773 | $20,900 | $0 | $0 |
| 2019 | $1,744 | $18,700 | $0 | $0 |
| 2018 | $1,518 | $16,600 | $0 | $0 |
| 2017 | $290 | $15,300 | $0 | $0 |
| 2016 | $1,512 | $16,800 | $0 | $0 |
| 2015 | $1,680 | $16,800 | $0 | $0 |
| 2013 | $2,273 | $22,733 | $0 | $0 |
| 2010 | -- | $33,330 | $1,671 | $31,659 |
Property History
| Date | Event | Price | List to Sale | Price per Sq Ft |
|---|---|---|---|---|
| 02/16/2026 02/16/26 | Price Changed | $165,000 | 0.0% | $149 / Sq Ft |
| 02/16/2026 02/16/26 | For Sale | $165,000 | -5.7% | $149 / Sq Ft |
| 02/04/2026 02/04/26 | Off Market | $174,900 | -- | -- |
| 11/07/2025 11/07/25 | For Sale | $174,900 | -- | $158 / Sq Ft |
Purchase History
| Date | Type | Sale Price | Title Company |
|---|---|---|---|
| Quit Claim Deed | $52,500 | None Available | |
| Warranty Deed | $52,000 | Embassy Title Agency | |
| Warranty Deed | $26,888 | Embassy Title Agency | |
| Warranty Deed | $61,000 | Fidelity Natl Title Ins Co | |
| Warranty Deed | $15,000 | Fidelity Natl Title Ins Co | |
| Sheriffs Deed | $105,378 | -- | |
| Deed | $85,000 | -- | |
| Deed | $42,000 | -- |
Source: Realcomp
MLS Number: 20251051780
APN: 21-080544
Disclaimer: Certain information contained herein is derived from information provided by parties other than Homes.com. All information provided is deemed reliable, but is not guaranteed to be accurate and should be independently verified.
![]() IDX provided courtesy of Realcomp II Ltd. via Ten-X and MLS
IDX provided courtesy of Realcomp II Ltd. via Ten-X and MLS
Copyright 2026 Realcomp II Ltd. Shareholders
IDX information is provided exclusively for consumers' personal, noncommercial use and may not be used for any purpose other than to identify prospective properties consumers may be interested in purchasing. The accuracy of all information, regardless of source, is not guaranteed or warranted. All information should be independently verified.
Listing Information presented by local MLS brokerage: Ten-X, local REALTOR®- Arlene Richardson - (888)-952-6393
- 5911 Audubon Rd
- 5784 Whittier St
- 11784 E Outer Dr
- 12125 E Outer Dr
- 5957 Three Mile Dr
- 5532 Kensington Ave
- 5783 Yorkshire Rd
- 5793 Yorkshire Rd
- 5266 Three Mile Dr
- 5911 Yorkshire Rd
- 5935 Yorkshire Rd
- 10802 and 10808 Nottingham Rd
- 14438 Harper Ave
- 16730 Chandler Park Dr
- 5225 Three Mile Dr
- 5236 Bedford St
- 5511 Bishop St
- 16801 Chandler Park Dr
- 5934 Haverhill St
- 5500 Haverhill St
- 5766 3 Mile Dr
- 5535 Devonshire Rd
- 5104 Haverhill St
- 5250 Berkshire St
- 16530 E Warren Ave Unit 209
- 4820 Haverhill St Unit 2
- 6010 Oldtown St
- 4480 Yorkshire Rd
- 5772 Guilford St
- 4865 Cadieux Rd Unit Apartment 11
- 4837 Cadieux Rd Unit Apartment 3
- 4837 Cadieux Rd Unit Apartment 9
- 4604 Bedford St
- 4812 Balfour Rd
- 4383 Bedford St
- 5737 Barham St
- 17143 Ontario St
- 6154 Woodhall St
- 4400 Buckingham Ave Unit Upper Unit
- 4651 Chatsworth St

Ask me questions while you tour the home.