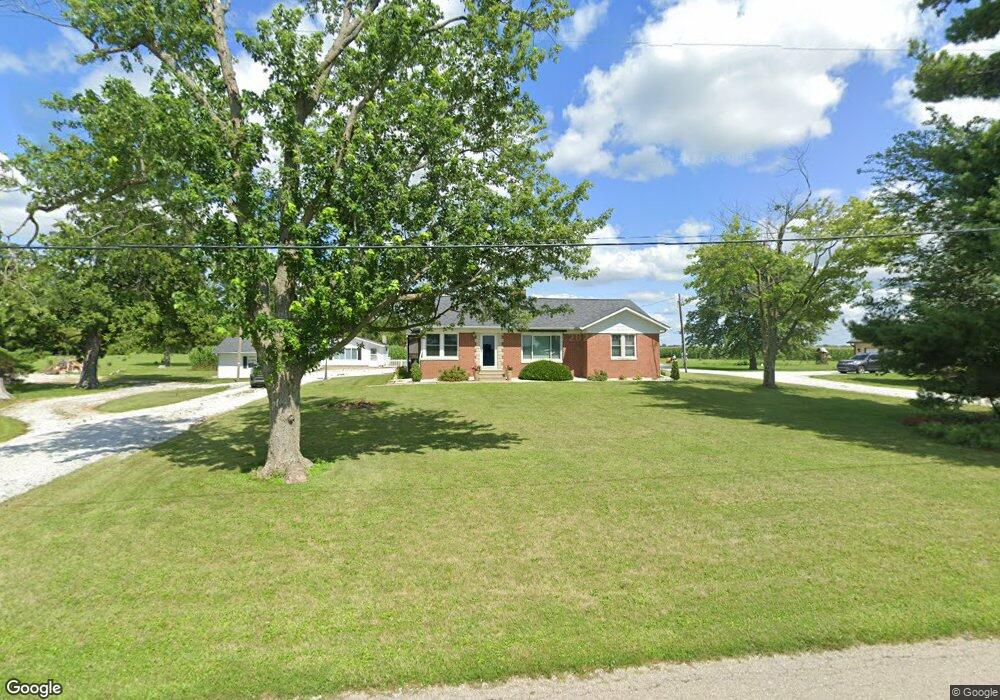
11926 N 200 W Fountaintown, IN 46130
Estimated Value: $270,081 - $456,000
3
Beds
2
Baths
1,606
Sq Ft
$219/Sq Ft
Est. Value
About This Home
This home is located at 11926 N 200 W, Fountaintown, IN 46130 and is currently estimated at $352,270, approximately $219 per square foot. 11926 N 200 W is a home located in Shelby County with nearby schools including Morristown Elementary School and Morristown Junior/Senior High School.
Ownership History
Date
Name
Owned For
Owner Type
Purchase Details
Closed on
Jun 30, 2020
Sold by
Jones Timothy D and Jones Genea W
Bought by
Jones Timothy D and Jones Genea White
Current Estimated Value
Home Financials for this Owner
Home Financials are based on the most recent Mortgage that was taken out on this home.
Original Mortgage
$116,000
Interest Rate
3.2%
Mortgage Type
New Conventional
Create a Home Valuation Report for This Property
The Home Valuation Report is an in-depth analysis detailing your home's value as well as a comparison with similar homes in the area
Home Values in the Area
Average Home Value in this Area
Purchase History
| Date | Buyer | Sale Price | Title Company |
|---|---|---|---|
| Jones Timothy D | -- | None Available |
Source: Public Records
Mortgage History
| Date | Status | Borrower | Loan Amount |
|---|---|---|---|
| Closed | Jones Timothy D | $116,000 |
Source: Public Records
Tax History Compared to Growth
Tax History
| Year | Tax Paid | Tax Assessment Tax Assessment Total Assessment is a certain percentage of the fair market value that is determined by local assessors to be the total taxable value of land and additions on the property. | Land | Improvement |
|---|---|---|---|---|
| 2024 | $3,125 | $202,600 | $18,200 | $184,400 |
| 2023 | $3,097 | $196,200 | $18,200 | $178,000 |
| 2022 | $2,979 | $189,800 | $18,200 | $171,600 |
| 2021 | $2,712 | $171,700 | $18,200 | $153,500 |
| 2020 | $2,595 | $166,200 | $18,200 | $148,000 |
| 2019 | $2,261 | $146,500 | $17,700 | $128,800 |
| 2018 | $883 | $134,400 | $17,700 | $116,700 |
| 2017 | $898 | $139,400 | $17,700 | $121,700 |
| 2016 | $887 | $144,700 | $17,700 | $127,000 |
| 2014 | $787 | $136,600 | $16,600 | $120,000 |
| 2013 | $787 | $131,600 | $16,000 | $115,600 |
Source: Public Records
Map
Nearby Homes
- 1069 W Railroad St
- 5465 S Greenfield St
- 5477 S Main St
- 5 U S 52
- 11546 N Shelby 300 W
- 6 U S 52
- 661 W 500 S
- 4500 S 50 W
- 83 E Walnut St
- 11497 N State Road 9
- 10686 N Division Rd
- 11131 N State Road 9
- 1546 E Osprey Dr
- 256 E 1000 N
- 11600 N 100 E
- 5555 S 200 E
- 1556 E 400 S
- 4673 S 400 W
- 1162 E 300 S
- 31 E Mill St