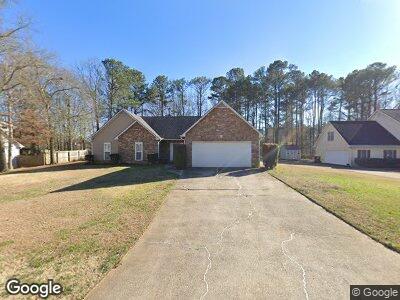
1193 Crestbrook Ln SW Mableton, GA 30126
Estimated Value: $359,000 - $483,000
4
Beds
3
Baths
2,165
Sq Ft
$191/Sq Ft
Est. Value
About This Home
This home is located at 1193 Crestbrook Ln SW, Mableton, GA 30126 and is currently estimated at $414,446, approximately $191 per square foot. 1193 Crestbrook Ln SW is a home located in Cobb County with nearby schools including Mableton Elementary School, Floyd Middle School, and Connection Pointe Christian Academy.
Ownership History
Date
Name
Owned For
Owner Type
Purchase Details
Closed on
Apr 6, 2012
Sold by
Danjan Llc
Bought by
Brooks Dandel
Current Estimated Value
Purchase Details
Closed on
Mar 10, 2011
Sold by
Brooks Dandell R
Bought by
Danjan Llc
Purchase Details
Closed on
Aug 28, 2009
Sold by
Deutsche Bk
Bought by
Brooks Dandel R
Home Financials for this Owner
Home Financials are based on the most recent Mortgage that was taken out on this home.
Original Mortgage
$88,000
Interest Rate
5.14%
Mortgage Type
New Conventional
Purchase Details
Closed on
Mar 3, 2009
Sold by
Orellana Elmer R
Bought by
Deutsche Bank Natl Trust Co
Purchase Details
Closed on
Jun 25, 1999
Sold by
Johnson Joyce
Bought by
Orrelana Elmer R and Orrelana Mirna A
Home Financials for this Owner
Home Financials are based on the most recent Mortgage that was taken out on this home.
Original Mortgage
$151,300
Interest Rate
7.27%
Mortgage Type
FHA
Create a Home Valuation Report for This Property
The Home Valuation Report is an in-depth analysis detailing your home's value as well as a comparison with similar homes in the area
Home Values in the Area
Average Home Value in this Area
Purchase History
| Date | Buyer | Sale Price | Title Company |
|---|---|---|---|
| Brooks Dandel | $62,812 | -- | |
| Danjan Llc | -- | -- | |
| Brooks Dandel R | $110,000 | -- | |
| Deutsche Bank Natl Trust Co | $85,118 | -- | |
| Orrelana Elmer R | $153,000 | -- |
Source: Public Records
Mortgage History
| Date | Status | Borrower | Loan Amount |
|---|---|---|---|
| Previous Owner | Brooks Dandel R | $88,000 | |
| Previous Owner | Orellana Elmer R | $169,995 | |
| Previous Owner | Orrelana Elmer R | $151,300 |
Source: Public Records
Tax History Compared to Growth
Tax History
| Year | Tax Paid | Tax Assessment Tax Assessment Total Assessment is a certain percentage of the fair market value that is determined by local assessors to be the total taxable value of land and additions on the property. | Land | Improvement |
|---|---|---|---|---|
| 2024 | $4,748 | $157,464 | $26,000 | $131,464 |
| 2023 | $4,748 | $157,464 | $26,000 | $131,464 |
| 2022 | $3,518 | $115,924 | $20,000 | $95,924 |
| 2021 | $630 | $103,036 | $20,000 | $83,036 |
| 2020 | $630 | $103,036 | $20,000 | $83,036 |
| 2019 | $608 | $95,824 | $18,000 | $77,824 |
| 2018 | $547 | $75,348 | $12,000 | $63,348 |
| 2017 | $490 | $75,348 | $12,000 | $63,348 |
| 2016 | $493 | $75,348 | $12,000 | $63,348 |
| 2015 | $498 | $67,020 | $12,000 | $55,020 |
| 2014 | $505 | $67,020 | $0 | $0 |
Source: Public Records
Map
Nearby Homes
- 4556 Sweetlake Rd SW
- 1129 Annie Ln SW Unit 2
- 5282 Concord Ridge Dr SW
- 4811 Brookwood Dr SW
- 4678 Glore Rd SW
- 0 Brookwood Dr Unit 10519191
- 0 Brookwood Dr Unit 7577066
- 1061 Retner Dr SW
- 4683 Heritage Lakes Ct SW
- 4905 Sweet Valley Rd SW
- 1156 Madison Green Ln SW
- 883 Ironhorse Ln SW
- 1270 Heritage Lakes Dr SW
- 0 Clay Rd SW Unit 10383943
- 0 Clay Rd SW Unit 7460886
- 4175 Waratah Way
- 5063 White Blvd SW
- 4523 Moray Dr
- 4527 Moray Dr
- 4541 Moray Dr
- 1193 Crestbrook Ln SW
- 1195 Crestbrook Ln SW
- 1191 Crestbrook Ln SW
- 1189 Crestbrook Ln SW Unit 72
- 1189 Crestbrook Ln SW
- 1197 Crestbrook Ln SW
- 1194 Crestbrook Ln SW
- 1196 Crestbrook Ln SW
- 1192 Crestbrook Ln SW
- 1194 Crestbrook Dr SW
- 1196 Crestbrook Dr SW
- 1192 Crestbrook Dr SW
- 1192 Crestbrook Dr SW Unit 70
- 1190 Crestbrook Dr SW Unit 250
- 1190 Crestbrook Dr SW
- 1198 Crestbrook Dr SW
- 0 Crestbrook Ln SW Unit 8658972
- 0 Crestbrook Ln SW Unit 8611789
- 0 Crestbrook Ln SW Unit 8414639
- 0 Crestbrook Ln SW Unit 8407906