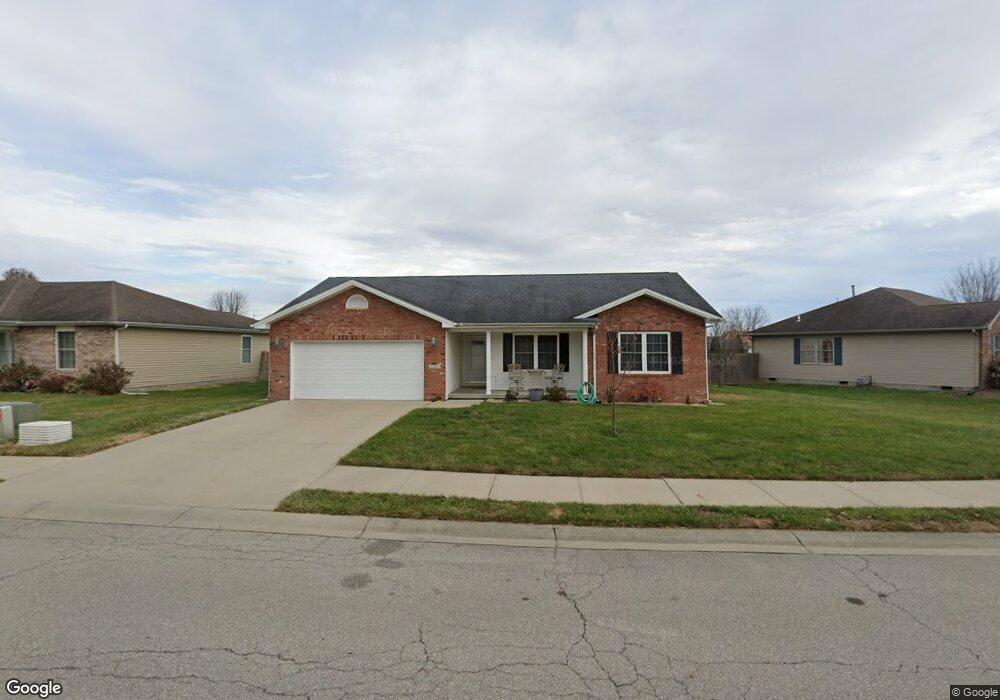
1193 Darcis Dr Seymour, IN 47274
Estimated Value: $232,000 - $253,000
3
Beds
2
Baths
1,544
Sq Ft
$154/Sq Ft
Est. Value
About This Home
This home is located at 1193 Darcis Dr, Seymour, IN 47274 and is currently estimated at $238,273, approximately $154 per square foot. 1193 Darcis Dr is a home located in Jackson County with nearby schools including Seymour-Redding Elementary School, Seymour Middle School, and Seymour Senior High School.
Ownership History
Date
Name
Owned For
Owner Type
Purchase Details
Closed on
Jul 24, 2009
Sold by
Hardy Brian P
Bought by
Holle Jeffrey A and Holle Rhonda S
Current Estimated Value
Home Financials for this Owner
Home Financials are based on the most recent Mortgage that was taken out on this home.
Original Mortgage
$127,551
Outstanding Balance
$84,006
Interest Rate
5.49%
Mortgage Type
New Conventional
Estimated Equity
$154,267
Create a Home Valuation Report for This Property
The Home Valuation Report is an in-depth analysis detailing your home's value as well as a comparison with similar homes in the area
Home Values in the Area
Average Home Value in this Area
Purchase History
| Date | Buyer | Sale Price | Title Company |
|---|---|---|---|
| Holle Jeffrey A | $125,000 | D & E Abstract And Title Co | |
| Holle Jeffrey A | -- | None Available |
Source: Public Records
Mortgage History
| Date | Status | Borrower | Loan Amount |
|---|---|---|---|
| Open | Holle Jeffrey A | $127,551 |
Source: Public Records
Tax History Compared to Growth
Tax History
| Year | Tax Paid | Tax Assessment Tax Assessment Total Assessment is a certain percentage of the fair market value that is determined by local assessors to be the total taxable value of land and additions on the property. | Land | Improvement |
|---|---|---|---|---|
| 2024 | $1,808 | $180,800 | $14,600 | $166,200 |
| 2023 | $1,625 | $168,700 | $14,600 | $154,100 |
| 2022 | $1,407 | $148,300 | $14,600 | $133,700 |
| 2021 | $1,088 | $133,900 | $14,600 | $119,300 |
| 2020 | $803 | $114,000 | $13,400 | $100,600 |
| 2019 | $797 | $114,000 | $13,400 | $100,600 |
| 2018 | $803 | $115,300 | $13,400 | $101,900 |
| 2017 | $960 | $114,100 | $13,400 | $100,700 |
| 2016 | $748 | $115,300 | $13,400 | $101,900 |
| 2014 | $819 | $108,500 | $17,800 | $90,700 |
| 2013 | $819 | $109,500 | $17,800 | $91,700 |
Source: Public Records
Map
Nearby Homes
- 1209 Dunbar Dr
- 424 Cara Ct
- 656 Berkshire Dr
- 1236 King Ave
- 802 Hustedt St
- 1687 Killion Ave
- 637 E 6th St
- 1661 Killion Ave
- 614 E 7th St
- 809 N Blish St
- 611 Blish St
- 901 N Park St
- 6827 Bluebird Ln
- 6842 Bluebird Ln
- 6823 Bluebird Ln
- 9162 Janelle Dr
- 500 E 14th St
- 6778 Redbud Ln
- 6762 Redbud Ln
- 6980 Meadow Run