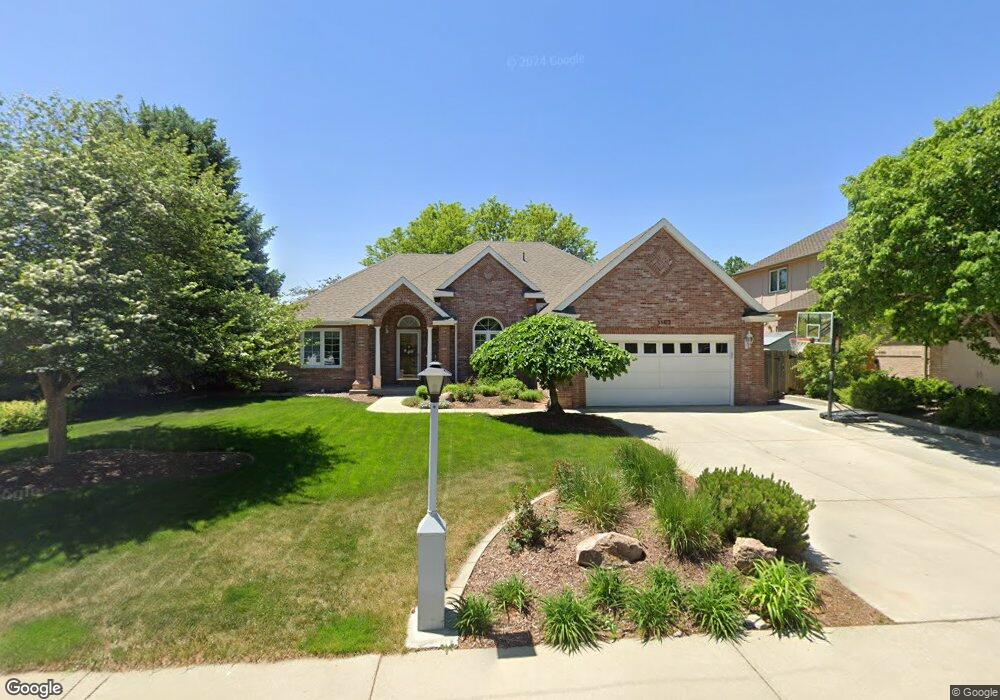
1193 Twin Peaks Cir Longmont, CO 80503
Longmont Estates NeighborhoodEstimated Value: $686,256 - $788,000
5
Beds
3
Baths
3,323
Sq Ft
$221/Sq Ft
Est. Value
About This Home
This home is located at 1193 Twin Peaks Cir, Longmont, CO 80503 and is currently estimated at $735,564, approximately $221 per square foot. 1193 Twin Peaks Cir is a home located in Boulder County with nearby schools including Longmont Estates Elementary School, Westview Middle School, and Silver Creek High School.
Ownership History
Date
Name
Owned For
Owner Type
Purchase Details
Closed on
Sep 7, 2011
Sold by
3D Ventures Llc
Bought by
Waller Scott
Current Estimated Value
Purchase Details
Closed on
Apr 11, 2011
Sold by
Wiecker Warren G and Firstbank Of Longmont
Bought by
3D Ventures Llc
Purchase Details
Closed on
Apr 29, 2003
Sold by
Peperzak Marcus B
Bought by
Wieckert Warren G
Home Financials for this Owner
Home Financials are based on the most recent Mortgage that was taken out on this home.
Original Mortgage
$262,100
Interest Rate
4.62%
Mortgage Type
Purchase Money Mortgage
Purchase Details
Closed on
Nov 1, 2002
Sold by
Ghadiani Brenda S and Ghadiani Massoud
Bought by
Peperzak Marcus B
Purchase Details
Closed on
Jul 6, 1993
Bought by
Waller Scott and Waller Renee
Purchase Details
Closed on
Sep 25, 1991
Bought by
Waller Scott and Waller Renee
Purchase Details
Closed on
May 6, 1991
Bought by
Waller Scott and Waller Renee
Create a Home Valuation Report for This Property
The Home Valuation Report is an in-depth analysis detailing your home's value as well as a comparison with similar homes in the area
Home Values in the Area
Average Home Value in this Area
Purchase History
| Date | Buyer | Sale Price | Title Company |
|---|---|---|---|
| Waller Scott | $350,000 | Land Title Guarantee Company | |
| 3D Ventures Llc | -- | None Available | |
| Wieckert Warren G | $349,500 | Commonwealth Title | |
| Peperzak Marcus B | $354,200 | -- | |
| Waller Scott | $220,000 | -- | |
| Waller Scott | $186,300 | -- | |
| Waller Scott | -- | -- | |
| Waller Scott | $33,500 | -- |
Source: Public Records
Mortgage History
| Date | Status | Borrower | Loan Amount |
|---|---|---|---|
| Previous Owner | Wieckert Warren G | $262,100 |
Source: Public Records
Tax History Compared to Growth
Tax History
| Year | Tax Paid | Tax Assessment Tax Assessment Total Assessment is a certain percentage of the fair market value that is determined by local assessors to be the total taxable value of land and additions on the property. | Land | Improvement |
|---|---|---|---|---|
| 2025 | $4,321 | $42,894 | $9,106 | $33,788 |
| 2024 | $4,321 | $42,894 | $9,106 | $33,788 |
| 2023 | $4,262 | $45,171 | $10,445 | $38,411 |
| 2022 | $3,686 | $37,252 | $7,937 | $29,315 |
| 2021 | $3,734 | $38,324 | $8,165 | $30,159 |
| 2020 | $3,218 | $33,126 | $7,365 | $25,761 |
| 2019 | $3,167 | $33,126 | $7,365 | $25,761 |
| 2018 | $2,851 | $30,017 | $7,416 | $22,601 |
| 2017 | $2,812 | $33,185 | $8,199 | $24,986 |
| 2016 | $2,819 | $29,492 | $8,438 | $21,054 |
| 2015 | $2,686 | $27,159 | $8,278 | $18,881 |
| 2014 | $2,702 | $28,926 | $8,278 | $20,648 |
Source: Public Records
Map
Nearby Homes
- 3729 Doral Dr
- 10930 N 85th St
- 1229 Twin Peaks Cir
- 3316 Camden Dr
- 3514 Mountain View Ave
- 3721 Columbia Dr
- 161 Baylor Dr
- 2900 Troxell Ave
- 3806 Findlay Ln
- 825 Wade Rd
- 1106 Purdue Dr
- 712 Wade Rd
- 1440 Northwestern Rd
- 1345 Northwestern Rd
- 1013 Berkeley Ct
- 1429 Auburn Ct
- 2810 Humboldt Cir
- 1037 Purdue Dr
- 2888 Humboldt Cir
- 1545 Drake St
- 1195 Twin Peaks Cir
- 1197 Twin Peaks Cir
- 1005 Champion Cir
- 1001 Champion Cir
- 1194 Twin Peaks Cir
- 1009 Champion Cir
- 1189 Twin Peaks Cir
- 971 Champion Cir
- 1196 Twin Peaks Cir
- 1015 Champion Cir
- 1190 Twin Peaks Cir
- 967 Champion Cir
- 1201 Twin Peaks Cir
- 1019 Champion Cir
- 963 Champion Cir
- 1198 Twin Peaks Cir
- 1178 Twin Peaks Cir
- 959 Champion Cir
- 1172 Twin Peaks Cir
- 1036 Champion Cir