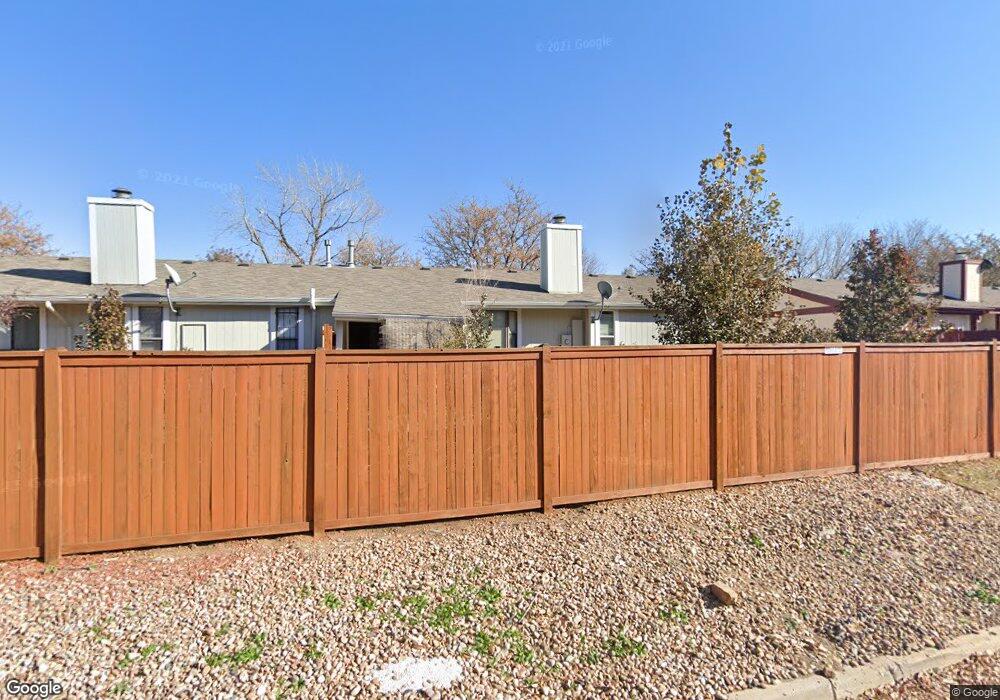
11930 E Maple Ave Aurora, CO 80012
Highline Villages NeighborhoodEstimated Value: $399,840 - $415,000
4
Beds
3
Baths
3,053
Sq Ft
$132/Sq Ft
Est. Value
About This Home
This home is located at 11930 E Maple Ave, Aurora, CO 80012 and is currently estimated at $403,960, approximately $132 per square foot. 11930 E Maple Ave is a home located in Arapahoe County with nearby schools including Lansing Elementary Community School, Aurora Hills Middle School, and Aurora Central High School.
Ownership History
Date
Name
Owned For
Owner Type
Purchase Details
Closed on
May 28, 2015
Sold by
Helen E Warden Trust
Bought by
Zhang Jiaxiang and Wen Shuifan
Current Estimated Value
Purchase Details
Closed on
Jun 14, 2000
Sold by
Westlake Donald J and Westlake Dorothy J
Bought by
Warden Helen E
Purchase Details
Closed on
Feb 13, 1998
Sold by
Oconnor James P and Oconnor Arlene M
Bought by
Westlake Donald J and Westlake Dorothy J
Home Financials for this Owner
Home Financials are based on the most recent Mortgage that was taken out on this home.
Original Mortgage
$90,000
Interest Rate
6.92%
Purchase Details
Closed on
Aug 28, 1986
Sold by
Conversion Arapco
Bought by
O'Connor Arlene M O'Connor James P
Purchase Details
Closed on
Jun 1, 1978
Sold by
Conversion Arapco
Bought by
Conversion Arapco
Purchase Details
Closed on
Jul 4, 1776
Bought by
Conversion Arapco
Create a Home Valuation Report for This Property
The Home Valuation Report is an in-depth analysis detailing your home's value as well as a comparison with similar homes in the area
Home Values in the Area
Average Home Value in this Area
Purchase History
| Date | Buyer | Sale Price | Title Company |
|---|---|---|---|
| Zhang Jiaxiang | $229,000 | First American Title Ins Co | |
| Warden Helen E | $174,900 | Land Title | |
| Westlake Donald J | $140,000 | Stewart Title | |
| O'Connor Arlene M O'Connor James P | -- | -- | |
| Conversion Arapco | -- | -- | |
| Conversion Arapco | -- | -- |
Source: Public Records
Mortgage History
| Date | Status | Borrower | Loan Amount |
|---|---|---|---|
| Previous Owner | Westlake Donald J | $90,000 |
Source: Public Records
Tax History
| Year | Tax Paid | Tax Assessment Tax Assessment Total Assessment is a certain percentage of the fair market value that is determined by local assessors to be the total taxable value of land and additions on the property. | Land | Improvement |
|---|---|---|---|---|
| 2025 | $2,636 | $26,206 | -- | -- |
| 2024 | $2,557 | $27,510 | -- | -- |
| 2023 | $2,557 | $27,510 | $0 | $0 |
| 2022 | $2,253 | $22,442 | $0 | $0 |
| 2021 | $2,326 | $22,442 | $0 | $0 |
| 2020 | $2,318 | $22,266 | $0 | $0 |
| 2019 | $2,306 | $22,266 | $0 | $0 |
| 2018 | $1,925 | $18,209 | $0 | $0 |
| 2017 | $1,675 | $18,209 | $0 | $0 |
| 2016 | $1,374 | $14,623 | $0 | $0 |
| 2015 | $663 | $14,623 | $0 | $0 |
| 2014 | $614 | $13,046 | $0 | $0 |
| 2013 | -- | $12,230 | $0 | $0 |
Source: Public Records
Map
Nearby Homes
- 11750 E Cedar Ave
- 12080 E Maple Ave
- 12024 E Maple Ave
- 11688 E Cedar Ave
- 178 S Nome St
- 126 S Nome St
- 12403 E Nevada Ave
- 11675 E Alaska Ave
- 46 S Nome St
- 128 S Moline St
- 88 S Moline St
- 378 S Racine St
- 14 Nome Way Unit C
- 4 Nome Way Unit D
- 11623 E Virginia Dr
- 13 Nome Way Unit A
- 64 Nome Way Unit A
- 12446 E Alaska Place
- 62 Newark St Unit C
- 12466 E Alaska Place
- 11932 E Maple Ave
- 11914 E Maple Ave
- 11934 E Maple Ave
- 11912 E Maple Ave
- 11940 E Maple Ave
- 11924 E Maple Ave
- 12040 E Maple Ave
- 11942 E Maple Ave
- 11922 E Maple Ave
- 11950 E Maple Ave
- 11910 E Maple Ave
- 11944 E Maple Ave
- 12042 E Maple Ave
- 12030 E Maple Ave
- 11920 E Maple Ave
- 12070 E Maple Ave
- 11946 E Maple Ave
- 12032 E Maple Ave
- 11952 E Maple Ave
- 12044 E Maple Ave
Your Personal Tour Guide
Ask me questions while you tour the home.