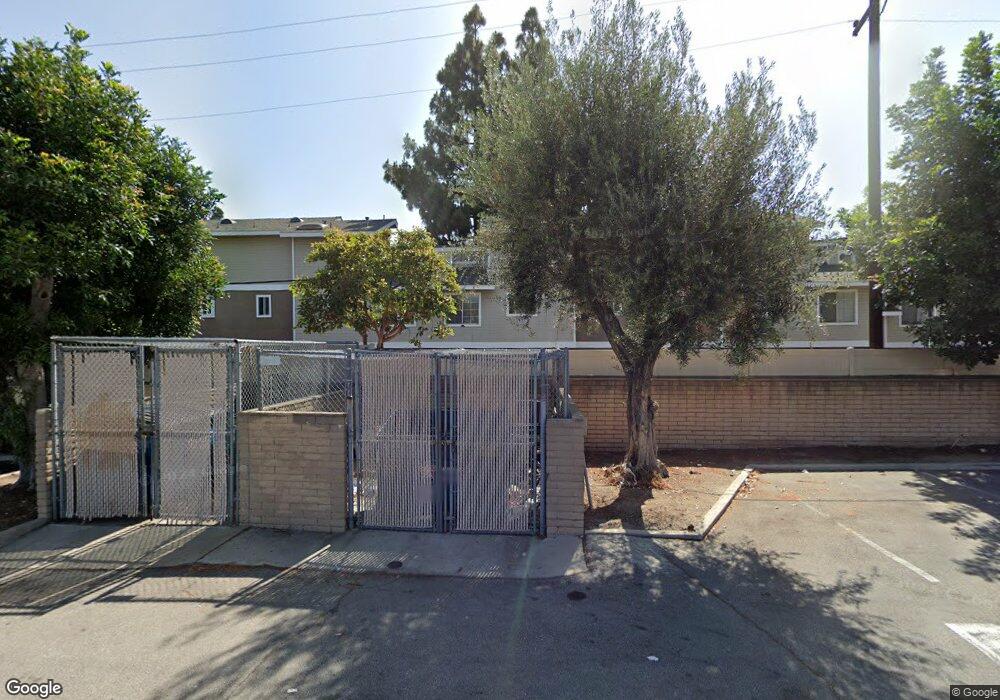
11936 Brookhaven St Unit 3 Garden Grove, CA 92840
Estimated Value: $540,000 - $586,000
2
Beds
2
Baths
1,081
Sq Ft
$524/Sq Ft
Est. Value
About This Home
This home is located at 11936 Brookhaven St Unit 3, Garden Grove, CA 92840 and is currently estimated at $565,913, approximately $523 per square foot. 11936 Brookhaven St Unit 3 is a home located in Orange County with nearby schools including Faylane Elementary School, Lake Intermediate School, and Rancho Alamitos High School.
Ownership History
Date
Name
Owned For
Owner Type
Purchase Details
Closed on
Sep 19, 2001
Sold by
Cline Kineth E and Sommath Ping C
Bought by
Crisalli Carmelo and Crisalli Tricia
Current Estimated Value
Home Financials for this Owner
Home Financials are based on the most recent Mortgage that was taken out on this home.
Original Mortgage
$164,803
Outstanding Balance
$63,702
Interest Rate
6.87%
Mortgage Type
FHA
Estimated Equity
$502,211
Purchase Details
Closed on
Feb 16, 1999
Sold by
Florita Albert P and Florita Shelley D
Bought by
Cline Kineth E and Sommath Ping C
Home Financials for this Owner
Home Financials are based on the most recent Mortgage that was taken out on this home.
Original Mortgage
$115,129
Interest Rate
6.76%
Mortgage Type
FHA
Create a Home Valuation Report for This Property
The Home Valuation Report is an in-depth analysis detailing your home's value as well as a comparison with similar homes in the area
Home Values in the Area
Average Home Value in this Area
Purchase History
| Date | Buyer | Sale Price | Title Company |
|---|---|---|---|
| Crisalli Carmelo | $170,000 | Commonwealth Land Title | |
| Cline Kineth E | $118,000 | Guardian Title Company | |
| Florita Albert P | -- | Guardian Title Company |
Source: Public Records
Mortgage History
| Date | Status | Borrower | Loan Amount |
|---|---|---|---|
| Open | Crisalli Carmelo | $164,803 | |
| Previous Owner | Cline Kineth E | $115,129 |
Source: Public Records
Tax History Compared to Growth
Tax History
| Year | Tax Paid | Tax Assessment Tax Assessment Total Assessment is a certain percentage of the fair market value that is determined by local assessors to be the total taxable value of land and additions on the property. | Land | Improvement |
|---|---|---|---|---|
| 2025 | $3,205 | $250,982 | $119,186 | $131,796 |
| 2024 | $3,205 | $246,061 | $116,849 | $129,212 |
| 2023 | $3,141 | $241,237 | $114,558 | $126,679 |
| 2022 | $3,090 | $236,507 | $112,311 | $124,196 |
| 2021 | $3,057 | $231,870 | $110,109 | $121,761 |
| 2020 | $3,022 | $229,493 | $108,980 | $120,513 |
| 2019 | $2,951 | $224,994 | $106,844 | $118,150 |
| 2018 | $2,902 | $220,583 | $104,749 | $115,834 |
| 2017 | $2,862 | $216,258 | $102,695 | $113,563 |
| 2016 | $2,725 | $212,018 | $100,681 | $111,337 |
| 2015 | $2,690 | $208,834 | $99,169 | $109,665 |
| 2014 | $2,600 | $204,744 | $97,227 | $107,517 |
Source: Public Records
Map
Nearby Homes
- 11912 Brookhaven St Unit 65
- 10072 Roselee Dr
- 10221 Roselee Dr
- 12266 Madras Place
- 9901 Royal Palm Blvd
- 12262 Morrie Ln
- 11762 Gary St
- 10181 Lampson Ave
- 12342 Rea Cir
- 11421 Barclay Dr
- 11971 Medina Dr
- 9751 Oma Place
- 9371 Cellini Ave
- 10442 Lampson Ave
- 12071 Diane St
- 11441 Dolan St
- 12071 Marlowe Dr
- 9762 Gamble Ave
- 9881 Aldgate Ave
- 10691 Perrin Dr
- 11879 Brookhaven St
- 11924 Brookhaven St Unit 71
- 11931 Brookhaven St Unit 24
- 11889 Brookhaven St Unit 12
- 11938 Brookhaven St Unit 2
- 11874 Brookhaven St Unit 54
- 11905 Brookhaven St
- 11919 Brookhaven St Unit 30
- 11896 Brookhaven St Unit 7
- 11874 Brookhaven St
- 11895 Brookhaven St Unit 17
- 11931 Brookhaven St
- 11905 Brookhaven St Unit 36
- 11892 Brookhaven St Unit 5
- 11876 Brookhaven St Unit 55
- 11871 Brookhaven St Unit 43
- 11902 Brookhaven St Unit 60
- 11915 Brookhaven St Unit 48
- 11868 Brookhaven St Unit 51
- 11894 Brookhaven St Unit 4