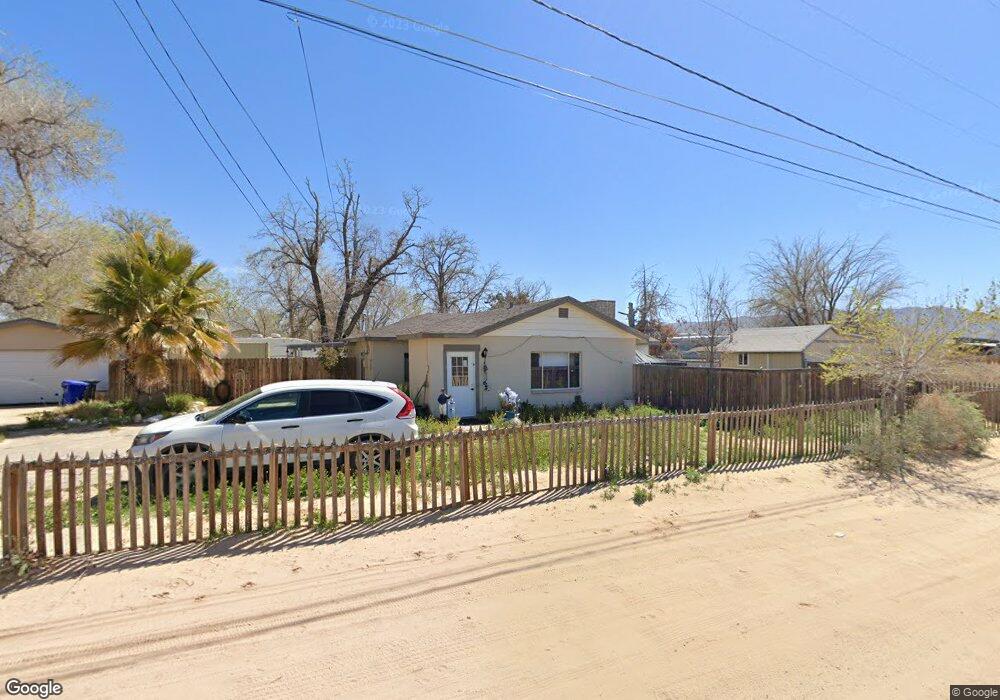
11937 Locust Ln Apple Valley, CA 92308
High Desert NeighborhoodEstimated Value: $234,000 - $359,735
2
Beds
2
Baths
1,510
Sq Ft
$205/Sq Ft
Est. Value
About This Home
This home is located at 11937 Locust Ln, Apple Valley, CA 92308 and is currently estimated at $310,184, approximately $205 per square foot. 11937 Locust Ln is a home located in San Bernardino County with nearby schools including Sitting Bull Academy, Apple Valley High School, and Excelsior Charter School.
Ownership History
Date
Name
Owned For
Owner Type
Purchase Details
Closed on
Jan 19, 2017
Sold by
Perry Forrest M
Bought by
Perry Edward A and Perry Noel
Current Estimated Value
Home Financials for this Owner
Home Financials are based on the most recent Mortgage that was taken out on this home.
Original Mortgage
$70,000
Outstanding Balance
$57,637
Interest Rate
4.09%
Mortgage Type
Purchase Money Mortgage
Estimated Equity
$252,547
Purchase Details
Closed on
Feb 12, 2010
Sold by
Smith Bruce Edward
Bought by
Miles Lydic Jeannette C and Miles Perry Forrest
Purchase Details
Closed on
Nov 5, 1998
Sold by
First Union Home Equity Bank Na
Bought by
Smith Bruce Edward and Smith Laura Mae
Home Financials for this Owner
Home Financials are based on the most recent Mortgage that was taken out on this home.
Original Mortgage
$46,000
Interest Rate
9.8%
Purchase Details
Closed on
Jul 13, 1998
Sold by
Burns William H and Burns Bonnie
Bought by
First Union Home Equity Bank Na
Create a Home Valuation Report for This Property
The Home Valuation Report is an in-depth analysis detailing your home's value as well as a comparison with similar homes in the area
Home Values in the Area
Average Home Value in this Area
Purchase History
| Date | Buyer | Sale Price | Title Company |
|---|---|---|---|
| Perry Edward A | $60,000 | Fatcola | |
| Miles Lydic Jeannette C | $72,000 | None Available | |
| Smith Bruce Edward | $57,500 | Lawyers Title Company | |
| First Union Home Equity Bank Na | $17,133 | American Title Co |
Source: Public Records
Mortgage History
| Date | Status | Borrower | Loan Amount |
|---|---|---|---|
| Open | Perry Edward A | $70,000 | |
| Previous Owner | Smith Bruce Edward | $46,000 |
Source: Public Records
Tax History Compared to Growth
Tax History
| Year | Tax Paid | Tax Assessment Tax Assessment Total Assessment is a certain percentage of the fair market value that is determined by local assessors to be the total taxable value of land and additions on the property. | Land | Improvement |
|---|---|---|---|---|
| 2025 | $2,307 | $198,460 | $34,817 | $163,643 |
| 2024 | $2,307 | $194,568 | $34,134 | $160,434 |
| 2023 | $2,286 | $190,753 | $33,465 | $157,288 |
| 2022 | $2,251 | $187,013 | $32,809 | $154,204 |
| 2021 | $2,200 | $183,346 | $32,166 | $151,180 |
| 2020 | $2,173 | $181,466 | $31,836 | $149,630 |
| 2019 | $2,133 | $177,908 | $31,212 | $146,696 |
| 2018 | $2,081 | $174,420 | $30,600 | $143,820 |
| 2017 | $1,050 | $80,080 | $33,367 | $46,713 |
| 2016 | $975 | $78,510 | $32,713 | $45,797 |
| 2015 | $960 | $77,331 | $32,222 | $45,109 |
| 2014 | $947 | $75,816 | $31,591 | $44,225 |
Source: Public Records
Map
Nearby Homes
- 19575 Bear Valley Rd
- 19773 Bear Valley Rd
- 0 Westmont Dr
- 19348 Birdie Way
- 1 Apple Valley Rd
- 19968 Bear Valley Rd
- 11670 Wedgewood Dr
- 11624 Ridgemark Rd
- 11620 Ridgemark Rd
- 11614 Ridgemark Rd
- 11600 Ridgemark Rd
- 11555 Wedgewood Dr
- 11577 Ridgemark Rd
- 19333 Town Center Dr
- 19234 Elm Dr
- 19355 Tournament Ln
- 11653 Pepper Ln
- 19218 Elm Dr
- 19236 Cottonwood Dr
- 0 Jess Ranch Pkwy
- 11957 Locust Ln
- 11934 Locust Ln
- 11955 Locust Ln
- 11966 Locust Ln
- 11897 Locust Ln
- 11897 Locust Ln Unit 2
- 12006 Locust Ln
- 12011 Locust Ln
- 11922 Locust Ln
- 12033 Locust Ln
- 11880 Locust Ln
- 19661 Locust Ln
- 19733 Bear Valley Rd
- 19675 Bear Valley Rd
- 11860 Locust Ln
- 19501 Bear Valley Rd
- 11815 Flying Feather Rd
- 11875 Cottontail Ln
- 11818 Flying Feather Rd
- 11702 Locust Ln