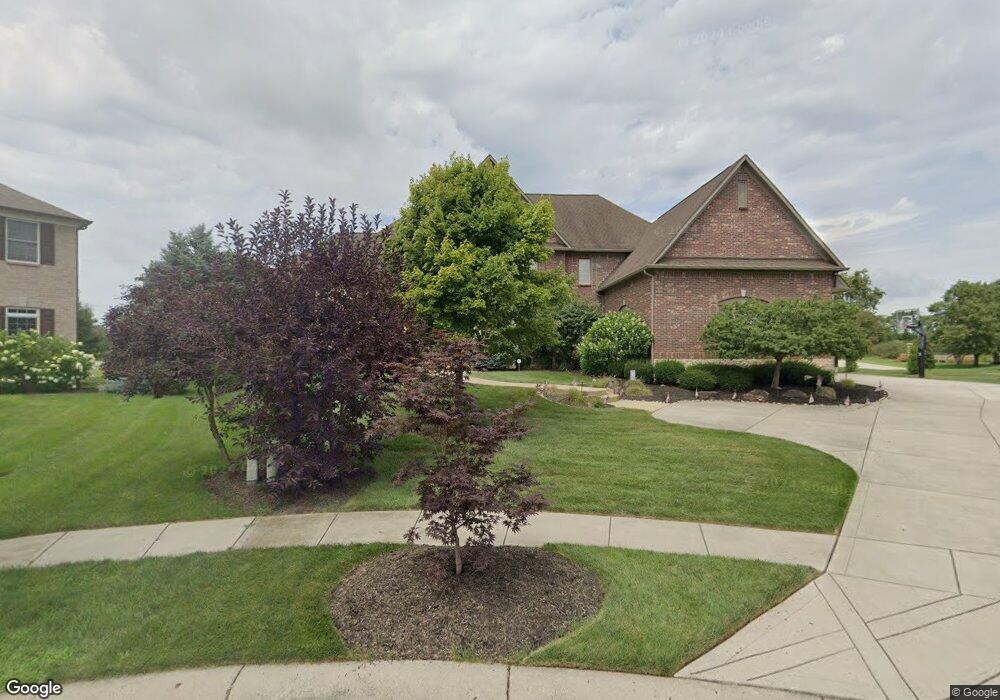
11939 Talnuck Cir Fishers, IN 46037
Estimated Value: $1,490,727 - $2,048,000
3
Beds
6
Baths
6,492
Sq Ft
$273/Sq Ft
Est. Value
About This Home
This home is located at 11939 Talnuck Cir, Fishers, IN 46037 and is currently estimated at $1,773,932, approximately $273 per square foot. 11939 Talnuck Cir is a home located in Hamilton County with nearby schools including Hickok Elementary School, Brooks School Elementary School, and Fall Creek Intermediate School.
Ownership History
Date
Name
Owned For
Owner Type
Purchase Details
Closed on
Oct 1, 2014
Sold by
Masheck Timothy H
Bought by
Timothy H Masheck Trust and Masheck Timothy H
Current Estimated Value
Purchase Details
Closed on
Jun 2, 2014
Sold by
Masheck Tim H and Masheck Michele J
Bought by
Masheck Timothy H
Home Financials for this Owner
Home Financials are based on the most recent Mortgage that was taken out on this home.
Original Mortgage
$350,000
Outstanding Balance
$257,398
Interest Rate
3.5%
Mortgage Type
Adjustable Rate Mortgage/ARM
Estimated Equity
$1,516,534
Purchase Details
Closed on
Sep 9, 2005
Sold by
Horizon Two Llc
Bought by
Masheck Tim H and Masheck Michele J
Home Financials for this Owner
Home Financials are based on the most recent Mortgage that was taken out on this home.
Original Mortgage
$801,750
Outstanding Balance
$414,189
Interest Rate
5.5%
Mortgage Type
Fannie Mae Freddie Mac
Estimated Equity
$1,359,743
Create a Home Valuation Report for This Property
The Home Valuation Report is an in-depth analysis detailing your home's value as well as a comparison with similar homes in the area
Home Values in the Area
Average Home Value in this Area
Purchase History
| Date | Buyer | Sale Price | Title Company |
|---|---|---|---|
| Timothy H Masheck Trust | -- | None Available | |
| Masheck Timothy H | -- | None Available | |
| Masheck Tim H | -- | -- |
Source: Public Records
Mortgage History
| Date | Status | Borrower | Loan Amount |
|---|---|---|---|
| Open | Masheck Timothy H | $350,000 | |
| Open | Masheck Tim H | $801,750 |
Source: Public Records
Tax History Compared to Growth
Tax History
| Year | Tax Paid | Tax Assessment Tax Assessment Total Assessment is a certain percentage of the fair market value that is determined by local assessors to be the total taxable value of land and additions on the property. | Land | Improvement |
|---|---|---|---|---|
| 2024 | $14,461 | $1,399,800 | $213,800 | $1,186,000 |
| 2023 | $14,461 | $1,224,100 | $213,800 | $1,010,300 |
| 2022 | $14,522 | $1,182,800 | $213,800 | $969,000 |
| 2021 | $12,747 | $1,033,100 | $213,800 | $819,300 |
| 2020 | $12,958 | $1,042,600 | $213,800 | $828,800 |
| 2019 | $12,958 | $1,042,600 | $170,700 | $871,900 |
| 2018 | $12,691 | $1,018,600 | $170,700 | $847,900 |
| 2017 | $843 | $970,100 | $170,700 | $799,400 |
| 2016 | $12,067 | $988,600 | $170,700 | $817,900 |
| 2014 | $9,934 | $903,400 | $130,600 | $772,800 |
| 2013 | $9,934 | $911,800 | $130,600 | $781,200 |
Source: Public Records
Map
Nearby Homes
- 11346 Talnuck Cir
- 11579 Townsend Ct
- 11581 Ludlow Dr
- 11722 Silver Meadow Ct
- 11318 Talon Trace
- 10675 Red Berry Ct
- 11101 Hawthorn Ridge
- 10725 Chase Ct
- 12430 Hyacinth Dr
- 12010 Landover Ln
- 11240 E 106th St
- 10982 Brooks School Rd
- 10704 Club Chase
- 12230 Cobblestone Dr
- 10990 Brooks School Rd
- 11216 Windermere Blvd
- 10573 E 116th St
- 12082 Aldenham Blvd
- 11287 Reflection Point Dr
- 11517 Moss Rock Ct
- 11949 Talnuck Cir
- 11959 Talnuck Cir
- 11942 Hawthorn Ridge
- 11954 Talnuck Cir
- 11952 Hawthorn Ridge
- 11962 Hawthorn Ridge
- 11969 Talnuck Cir
- 11974 Talnuck Cir
- 11973 Hawthorn Ridge
- 11972 Hawthorn Ridge
- 11979 Talnuck Cir
- 11982 Hawthorn Ridge
- 11983 Hawthorn Ridge
- 11989 Talnuck Cir
- 11336 Talnuck Cir
- 11356 Talnuck Cir
- 11992 Hawthorn Ridge
- 11366 Talnuck Cir
- 11399 Hawthorn Ridge W
- 11999 Talnuck Cir