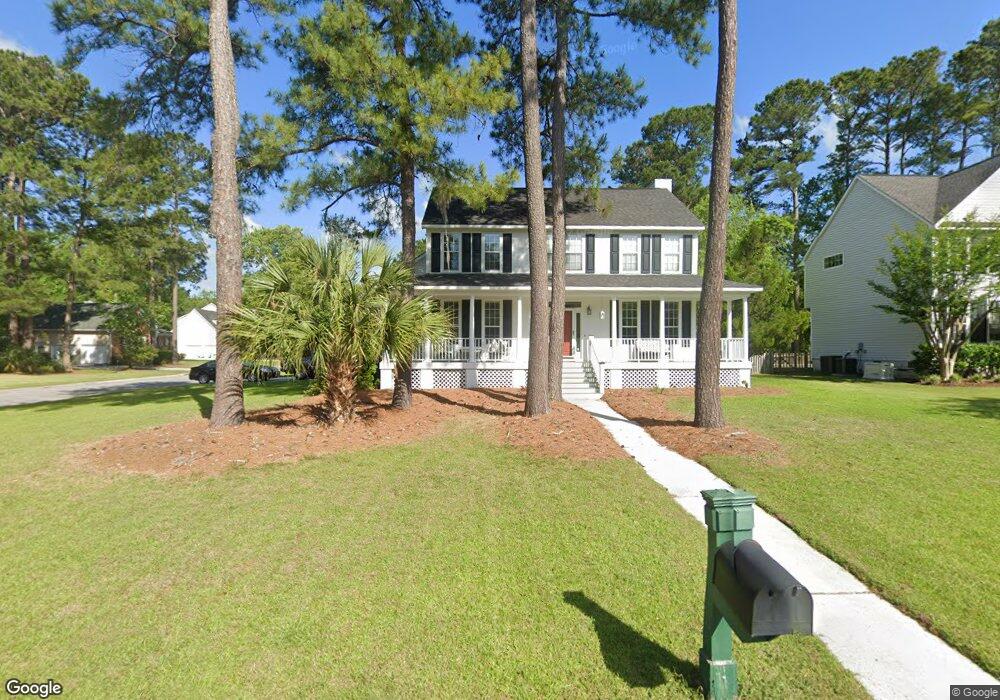
1194 Out of Bounds Dr Summerville, SC 29485
Estimated Value: $449,255 - $502,000
4
Beds
3
Baths
2,072
Sq Ft
$227/Sq Ft
Est. Value
About This Home
This home is located at 1194 Out of Bounds Dr, Summerville, SC 29485 and is currently estimated at $470,814, approximately $227 per square foot. 1194 Out of Bounds Dr is a home located in Dorchester County with nearby schools including Beech Hill Elementary School and Ashley Ridge High School.
Ownership History
Date
Name
Owned For
Owner Type
Purchase Details
Closed on
Aug 31, 2021
Sold by
Baumer Howard A and Baumer Kari B
Bought by
Baumer Howard A
Current Estimated Value
Home Financials for this Owner
Home Financials are based on the most recent Mortgage that was taken out on this home.
Original Mortgage
$286,000
Outstanding Balance
$260,239
Interest Rate
2.8%
Mortgage Type
New Conventional
Estimated Equity
$210,575
Purchase Details
Closed on
Aug 18, 2006
Sold by
Ware Clifton L and Ware Brandi A
Bought by
Custer Jeffrey L and Custer Kendra L
Home Financials for this Owner
Home Financials are based on the most recent Mortgage that was taken out on this home.
Original Mortgage
$20,000
Interest Rate
6.32%
Mortgage Type
Stand Alone Second
Purchase Details
Closed on
Aug 13, 2004
Sold by
Cook Gregory T and Cook Roann B
Bought by
Ware Clifton L and Ware Brandi A
Purchase Details
Closed on
Sep 30, 1999
Sold by
Anderson L Mctier
Bought by
Cook Gregory T
Create a Home Valuation Report for This Property
The Home Valuation Report is an in-depth analysis detailing your home's value as well as a comparison with similar homes in the area
Home Values in the Area
Average Home Value in this Area
Purchase History
| Date | Buyer | Sale Price | Title Company |
|---|---|---|---|
| Baumer Howard A | -- | None Available | |
| Custer Jeffrey L | $240,000 | None Available | |
| Ware Clifton L | $229,000 | -- | |
| Cook Gregory T | $190,000 | -- |
Source: Public Records
Mortgage History
| Date | Status | Borrower | Loan Amount |
|---|---|---|---|
| Open | Baumer Howard A | $286,000 | |
| Previous Owner | Custer Jeffrey L | $20,000 | |
| Previous Owner | Custer Jeffrey L | $192,000 |
Source: Public Records
Tax History Compared to Growth
Tax History
| Year | Tax Paid | Tax Assessment Tax Assessment Total Assessment is a certain percentage of the fair market value that is determined by local assessors to be the total taxable value of land and additions on the property. | Land | Improvement |
|---|---|---|---|---|
| 2024 | $2,083 | $15,426 | $4,000 | $11,426 |
| 2023 | $2,083 | $10,171 | $3,000 | $7,171 |
| 2022 | $1,855 | $10,170 | $3,000 | $7,170 |
| 2021 | $1,855 | $15,260 | $4,500 | $10,760 |
| 2020 | $1,737 | $9,170 | $2,000 | $7,170 |
| 2019 | $1,681 | $9,170 | $2,000 | $7,170 |
| 2018 | $1,527 | $9,170 | $2,000 | $7,170 |
| 2017 | $1,517 | $9,170 | $2,000 | $7,170 |
| 2016 | $1,504 | $9,170 | $2,000 | $7,170 |
| 2015 | $1,498 | $9,170 | $2,000 | $7,170 |
| 2014 | $1,504 | $237,245 | $0 | $0 |
| 2013 | -- | $9,490 | $0 | $0 |
Source: Public Records
Map
Nearby Homes
- 802 Long Drive Rd
- 126 Golfview Ln
- 102 Old Course Rd
- 168 Golfview Ln
- 163 Golfview Ln
- 115 Swaying Palm Dr
- 139 Back Tee Cir
- 103 Sherry Ct
- 135 Corral Cir
- 114 Marshside Dr
- 116 Marshside Dr
- 100 Cottage Path Ln
- 161 Carolinian Dr
- 127 Marshside Dr
- 0 Oak Dr Unit 25022600
- 142 Veranda Dr
- 1309 Berry Grove Dr
- 1302 Berry Grove Dr
- 310 Sprucewood Dr
- 1105 Mossy Rock Dr
- 1192 Out of Bounds Dr
- 1009 Crooked Oak Rd
- 1196 Out of Bounds Dr
- 1190 Out of Bounds Dr
- 1195 Out of Bounds Dr
- 1008 Crooked Oak Rd
- 1007 Crooked Oak Rd
- 1193 Out of Bounds Dr
- 1197 Out of Bounds Dr
- 803 Bent Green Ct
- 1199 Out of Bounds Dr
- 1191 Out of Bounds Dr
- 1006 Crooked Oak Rd
- 1188 Out of Bounds Dr
- 1005 Crooked Oak Rd
- 1189 Out of Bounds Dr
- 801 Bent Green Ct
- 804 Bent Green Ct
- 1201 Out of Bounds Dr
- 2003 Carriage Way