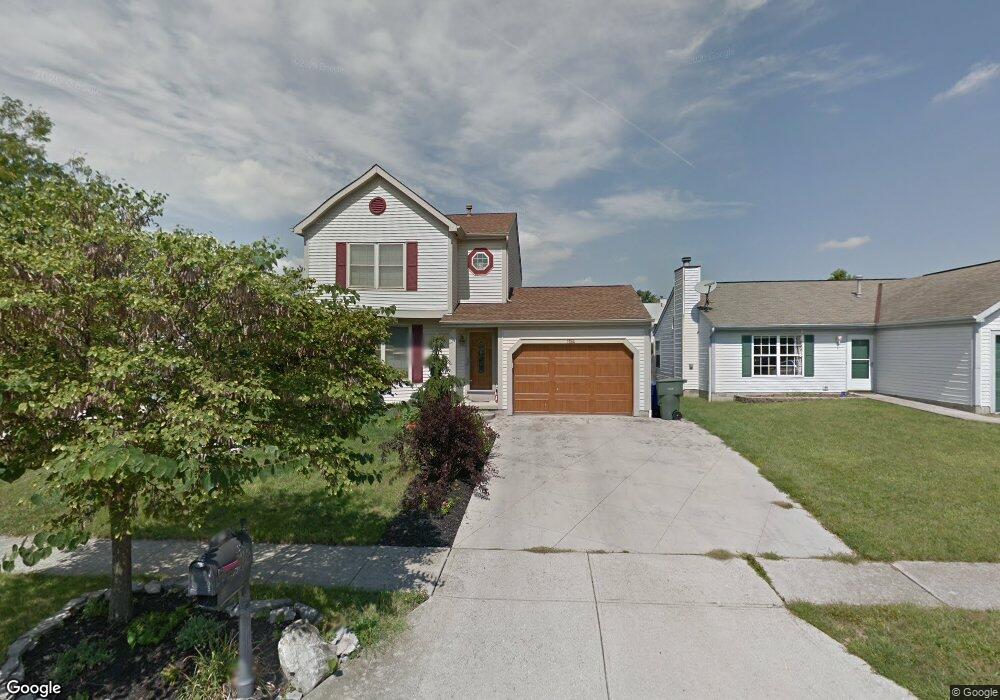
1194 Treehaven Ln Columbus, OH 43204
Brookshire NeighborhoodEstimated Value: $255,381 - $265,000
3
Beds
3
Baths
1,431
Sq Ft
$182/Sq Ft
Est. Value
About This Home
This home is located at 1194 Treehaven Ln, Columbus, OH 43204 and is currently estimated at $261,095, approximately $182 per square foot. 1194 Treehaven Ln is a home located in Franklin County with nearby schools including West Franklin Elementary School, Franklin Woods Intermediate School, and Finland Middle School.
Ownership History
Date
Name
Owned For
Owner Type
Purchase Details
Closed on
Jun 20, 2017
Sold by
Mann Paula
Bought by
Mann Edward H
Current Estimated Value
Home Financials for this Owner
Home Financials are based on the most recent Mortgage that was taken out on this home.
Original Mortgage
$137,000
Outstanding Balance
$68,594
Interest Rate
3.95%
Mortgage Type
VA
Estimated Equity
$192,501
Purchase Details
Closed on
Mar 2, 2005
Sold by
Mann Edward H
Bought by
Mann Edward H and Mann Paula
Home Financials for this Owner
Home Financials are based on the most recent Mortgage that was taken out on this home.
Original Mortgage
$140,000
Interest Rate
6.6%
Mortgage Type
New Conventional
Purchase Details
Closed on
Apr 4, 1995
Sold by
M/I Schottenstein Homes
Bought by
Edward H Mann
Home Financials for this Owner
Home Financials are based on the most recent Mortgage that was taken out on this home.
Original Mortgage
$98,634
Interest Rate
7.5%
Mortgage Type
VA
Purchase Details
Closed on
May 24, 1993
Create a Home Valuation Report for This Property
The Home Valuation Report is an in-depth analysis detailing your home's value as well as a comparison with similar homes in the area
Home Values in the Area
Average Home Value in this Area
Purchase History
| Date | Buyer | Sale Price | Title Company |
|---|---|---|---|
| Mann Edward H | -- | None Available | |
| Mann Edward H | -- | Lawyers T | |
| Edward H Mann | $96,700 | -- | |
| -- | -- | -- |
Source: Public Records
Mortgage History
| Date | Status | Borrower | Loan Amount |
|---|---|---|---|
| Open | Mann Edward H | $137,000 | |
| Closed | Mann Edward H | $140,000 | |
| Closed | Edward H Mann | $98,634 | |
| Closed | Mann Edward H | $35,000 |
Source: Public Records
Tax History
| Year | Tax Paid | Tax Assessment Tax Assessment Total Assessment is a certain percentage of the fair market value that is determined by local assessors to be the total taxable value of land and additions on the property. | Land | Improvement |
|---|---|---|---|---|
| 2025 | $2,952 | $80,960 | $20,690 | $60,270 |
| 2024 | $2,952 | $80,960 | $20,690 | $60,270 |
| 2023 | $2,900 | $80,955 | $20,685 | $60,270 |
| 2022 | $2,481 | $50,830 | $7,810 | $43,020 |
| 2021 | $2,531 | $50,830 | $7,810 | $43,020 |
| 2020 | $2,516 | $50,830 | $7,810 | $43,020 |
| 2019 | $2,339 | $41,690 | $6,510 | $35,180 |
| 2018 | $2,332 | $41,690 | $6,510 | $35,180 |
| 2017 | $2,317 | $41,690 | $6,510 | $35,180 |
| 2016 | $2,239 | $37,000 | $6,200 | $30,800 |
| 2015 | $2,336 | $37,000 | $6,200 | $30,800 |
| 2014 | $2,241 | $37,000 | $6,200 | $30,800 |
| 2013 | $1,284 | $41,125 | $6,895 | $34,230 |
Source: Public Records
Map
Nearby Homes
- 3318 Miriam Dr S
- 3340 Miriam Dr S
- 3664-3670 Mccarley Dr S
- 3551 Glorious Rd
- 1175-1177 Mccarley Dr S
- 840 Mark Place
- 814 Miriam Dr W
- 988 S Roys Ave
- 3029 Rosedale Ave
- 894 Binns Blvd
- 1605 Greenville Rd
- 3407 Western Hill Rd
- 1638 Tall Meadows Dr
- 695 Demorest Rd
- 1490 Demorest Rd
- 1657 Ripplebrook Rd
- 912 Maurine Dr
- 793 Binns Blvd
- 2937 Rundell Dr
- 811 Chestershire Rd
- 1200 Treehaven Ln
- 1186 Treehaven Ln
- 1206 Treehaven Ln
- 1135 Pinnacle Dr
- 1143 Pinnacle Dr
- 1135 Pinnacle Dr Unit Lot 433
- 1135 Pinnacle Dr
- 1147 Pinnacle Dr
- 1151 Pinnacle Dr
- 1223 Treehaven Ln
- 1229 Treehaven Ln
- 1215 Treehaven Ln
- 1212 Treehaven Ln
- 1159 Pinnacle Dr
- 1159 Pinnacle Dr
- 1209 Treehaven Ln
- 1173 Treehaven Ln
- 1167 Pinnacle Dr
- 1179 Treehaven Ln
- 1218 Treehaven Ln
Your Personal Tour Guide
Ask me questions while you tour the home.