Estimated Value: $181,000 - $237,000
3
Beds
2
Baths
1,590
Sq Ft
$125/Sq Ft
Est. Value
About This Home
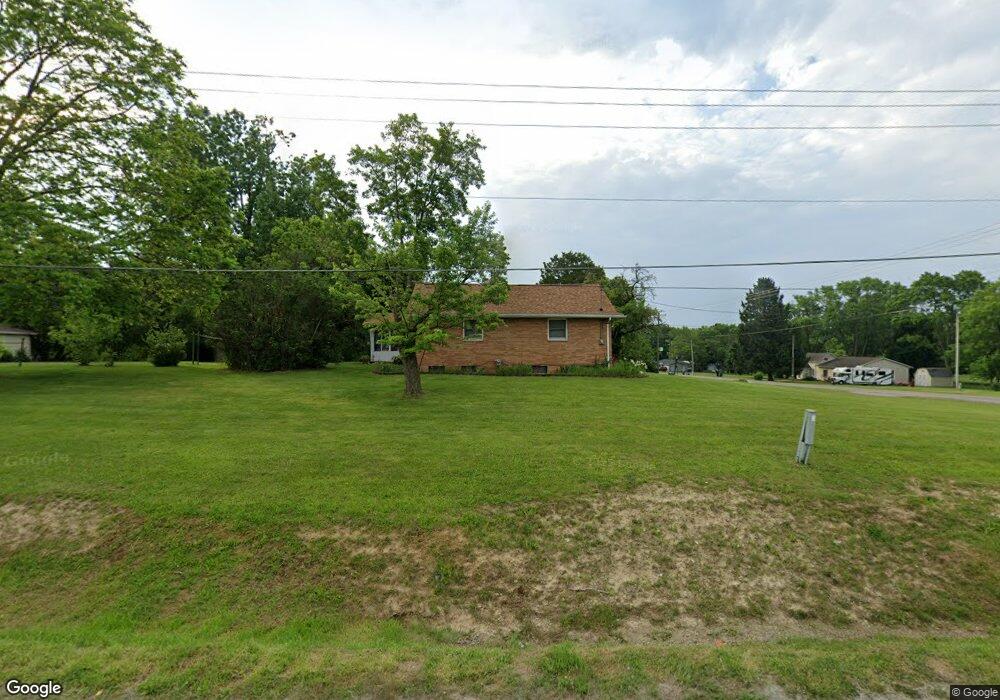
This home is located at 1195 S Graham Rd, Flint, MI 48532 and is currently estimated at $198,433, approximately $124 per square foot. 1195 S Graham Rd is a home located in Genesee County with nearby schools including Carman-Ainsworth High School, Genesee STEM Academy, and St. Paul Lutheran School.
Ownership History
Date
Name
Owned For
Owner Type
Purchase Details
Closed on
Mar 7, 2018
Sold by
Gergson Laura J
Bought by
Gregson Laura J and Johnson Linda D
Current Estimated Value
Purchase Details
Closed on
Aug 12, 2011
Sold by
Britton Laura R and Estate Of Ruth Marie Woodcock
Bought by
Gregson Laura J
Purchase Details
Closed on
Jun 26, 2007
Sold by
Johnson Linda D and Gregson Laura J
Bought by
Gregson Laura J
Home Financials for this Owner
Home Financials are based on the most recent Mortgage that was taken out on this home.
Original Mortgage
$25,000
Interest Rate
6.54%
Mortgage Type
New Conventional
Purchase Details
Closed on
Oct 6, 2004
Sold by
Woodcock Ruth M and Woodcock Luther Abraham
Bought by
Woodcock Ruth M and Johnson Linda D
Purchase Details
Closed on
Nov 11, 1996
Sold by
Woodcock Ruth Marie and Woodcock Luther Abraham
Bought by
Woodcock Ruth Marie and Gregson Laura Jane
Create a Home Valuation Report for This Property
The Home Valuation Report is an in-depth analysis detailing your home's value as well as a comparison with similar homes in the area
Home Values in the Area
Average Home Value in this Area
Purchase History
| Date | Buyer | Sale Price | Title Company |
|---|---|---|---|
| Gregson Laura J | -- | None Available | |
| Gregson Laura J | -- | None Available | |
| Gregson Laura J | -- | Lawyers Title | |
| Woodcock Ruth M | -- | -- | |
| Woodcock Ruth Marie | -- | -- | |
| Woodcock Ruth Marie | -- | -- |
Source: Public Records
Mortgage History
| Date | Status | Borrower | Loan Amount |
|---|---|---|---|
| Previous Owner | Gregson Laura J | $25,000 |
Source: Public Records
Tax History Compared to Growth
Tax History
| Year | Tax Paid | Tax Assessment Tax Assessment Total Assessment is a certain percentage of the fair market value that is determined by local assessors to be the total taxable value of land and additions on the property. | Land | Improvement |
|---|---|---|---|---|
| 2025 | $2,447 | $81,000 | $0 | $0 |
| 2024 | $1,241 | $73,600 | $0 | $0 |
| 2023 | $1,184 | $63,900 | $0 | $0 |
| 2022 | $1,082 | $55,800 | $0 | $0 |
| 2021 | $2,165 | $54,100 | $0 | $0 |
| 2020 | $1,064 | $52,200 | $0 | $0 |
| 2019 | $1,048 | $51,700 | $0 | $0 |
| 2018 | $2,019 | $52,600 | $0 | $0 |
| 2017 | $1,946 | $52,600 | $0 | $0 |
| 2016 | $2,039 | $52,300 | $0 | $0 |
| 2015 | $1,761 | $45,600 | $0 | $0 |
| 2014 | $1,045 | $44,000 | $0 | $0 |
| 2012 | -- | $42,900 | $42,900 | $0 |
Source: Public Records
Map
Nearby Homes
- 1260 Gilbert St
- 1068 S Graham Rd
- 1136 Gilbert St
- 1058 Cora Dr
- Graham Rd N Graham Rd
- 3493 Ridgecliffe Dr
- 3528 Beecher Rd
- 1540 Pound Dr
- 3522 Ridgecliffe Dr
- 1193 Normandy Terrace Dr
- 3288 Tall Oaks Ct
- 1112 Lask Dr
- 4022 Beecher Rd
- 3320 Timberview St
- 2 Charter Dr
- 3360 Beecher Rd
- 3631 Ridgecliffe Dr
- 0 Charter Dr Unit 50153638
- 3350 Beecher Rd
- 3477 Ridgecliffe Dr
- 1237 S Graham Rd
- 1167 S Graham Rd
- 1155 S Graham Rd
- 1255 S Graham Rd
- 1248 S Graham Rd
- 1271 S Graham Rd
- 1137 S Graham Rd
- 1279 S Graham Rd
- G4058 W Court St
- 1133 S Graham Rd
- 1287 S Graham Rd
- 1206 S Graham Rd
- 1218 S Graham Rd
- 1119 S Graham Rd
- 1214 Gilbert St
- 1238 S Graham Rd
- 1297 S Graham Rd
- 1200 Gilbert St
- 1194 Gilbert St
- 1236 Gilbert St