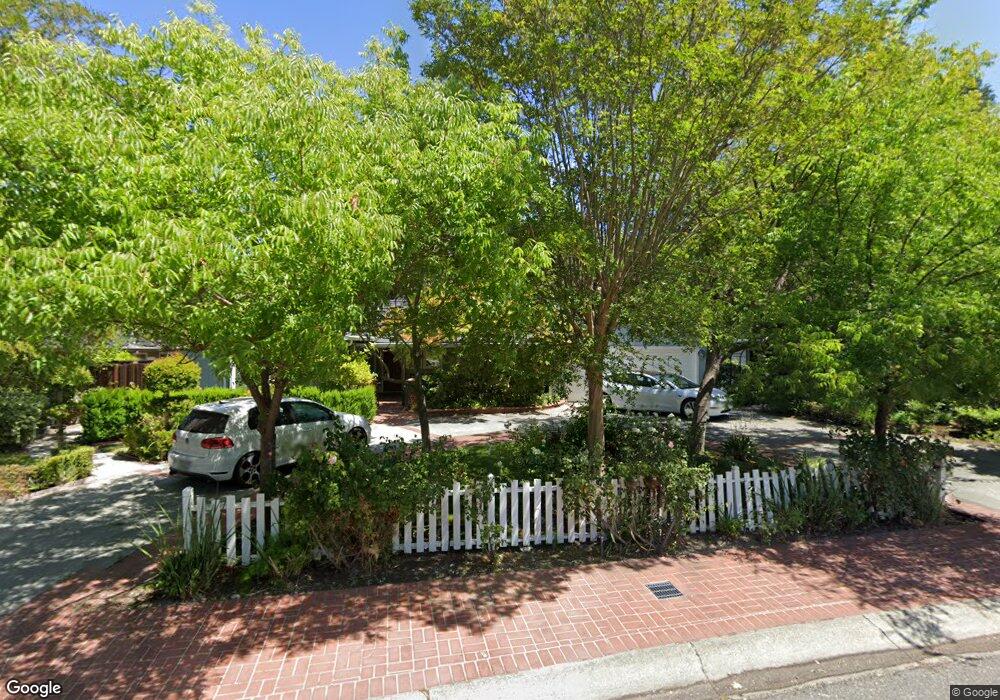
11950 Walbrook Dr Saratoga, CA 95070
Country Lane NeighborhoodEstimated Value: $3,478,000 - $4,209,000
4
Beds
4
Baths
2,710
Sq Ft
$1,443/Sq Ft
Est. Value
About This Home
This home is located at 11950 Walbrook Dr, Saratoga, CA 95070 and is currently estimated at $3,911,876, approximately $1,443 per square foot. 11950 Walbrook Dr is a home located in Santa Clara County with nearby schools including Country Lane Elementary School, Moreland Middle School, and Prospect High School.
Ownership History
Date
Name
Owned For
Owner Type
Purchase Details
Closed on
Jul 22, 2011
Sold by
Clark Charles R and Nguyen Clark Hanh T
Bought by
Baker Robert L and Baker Wendi E
Current Estimated Value
Home Financials for this Owner
Home Financials are based on the most recent Mortgage that was taken out on this home.
Original Mortgage
$1,058,000
Outstanding Balance
$726,152
Interest Rate
4.46%
Mortgage Type
New Conventional
Estimated Equity
$3,185,724
Purchase Details
Closed on
Aug 1, 2000
Sold by
Lester Stanley E
Bought by
Clark Charles R and Nguyen Clark Hanh T
Home Financials for this Owner
Home Financials are based on the most recent Mortgage that was taken out on this home.
Original Mortgage
$1,200,000
Interest Rate
5.25%
Purchase Details
Closed on
Jan 17, 1995
Sold by
Lester Hazel B
Bought by
Lester Hazel B and Lester Stanley E
Create a Home Valuation Report for This Property
The Home Valuation Report is an in-depth analysis detailing your home's value as well as a comparison with similar homes in the area
Home Values in the Area
Average Home Value in this Area
Purchase History
| Date | Buyer | Sale Price | Title Company |
|---|---|---|---|
| Baker Robert L | $1,322,500 | Old Republic Title Comapany | |
| Clark Charles R | $1,600,000 | Old Republic Title Company | |
| Lester Hazel B | -- | -- |
Source: Public Records
Mortgage History
| Date | Status | Borrower | Loan Amount |
|---|---|---|---|
| Open | Baker Robert L | $1,058,000 | |
| Previous Owner | Clark Charles R | $1,200,000 |
Source: Public Records
Tax History Compared to Growth
Tax History
| Year | Tax Paid | Tax Assessment Tax Assessment Total Assessment is a certain percentage of the fair market value that is determined by local assessors to be the total taxable value of land and additions on the property. | Land | Improvement |
|---|---|---|---|---|
| 2025 | $21,095 | $1,661,124 | $1,328,903 | $332,221 |
| 2024 | $21,095 | $1,628,554 | $1,302,847 | $325,707 |
| 2023 | $21,095 | $1,596,622 | $1,277,301 | $319,321 |
| 2022 | $20,570 | $1,565,316 | $1,252,256 | $313,060 |
| 2021 | $20,278 | $1,534,624 | $1,227,702 | $306,922 |
| 2020 | $19,984 | $1,518,889 | $1,215,114 | $303,775 |
| 2019 | $19,196 | $1,489,108 | $1,191,289 | $297,819 |
| 2018 | $18,822 | $1,459,911 | $1,167,931 | $291,980 |
| 2017 | $18,571 | $1,431,286 | $1,145,031 | $286,255 |
| 2016 | $17,569 | $1,403,223 | $1,122,580 | $280,643 |
| 2015 | $17,410 | $1,382,146 | $1,105,718 | $276,428 |
| 2014 | $16,999 | $1,355,073 | $1,084,059 | $271,014 |
Source: Public Records
Map
Nearby Homes
- 5635 W Walbrook Dr
- 12140 Woodside Dr
- 1577 Maurice Ln
- 1367 Cordelia Ave
- 1587 Miller Ave
- 5043 Le Miccine Terrace Unit 76
- 1681 Danromas Way
- 12584 Paseo Flores
- 1092 Strayer Dr
- 1957 Colusa Way
- 5887 Amapola Dr
- 6117 Brigantine Dr
- 1063 Whitebick Dr
- 11315 Cottonwood Place Unit 39-09 Plan 3
- 11210 Cottonwood Place Unit 35-08 Plan 4
- 11220 Cottonwood Place Unit 36-08 Plan 2
- 11240 Cottonwood Place Unit 38-08 Plan 3
- Plan 2 at The Elms
- Plan 3 at The Elms
- Plan 4 at The Elms
- 11930 Walbrook Dr
- 11970 Walbrook Dr
- 11910 Walbrook Dr
- 11975 Walbrook Dr
- 18961 Sunnybrook Ct
- 1655 English Dr
- 18941 Sunnybrook Ct
- 1659 English Dr
- 11955 Walbrook Dr
- 1647 English Dr
- 1667 English Dr
- 11890 Walbrook Dr
- 18921 Sunnybrook Ct
- 11935 Shadybrook Ct
- 1673 English Dr
- 11995 Walbrook Dr
- 1635 English Dr
- 11940 Brookglen Dr
- 1681 English Dr
- 1658 English Ct