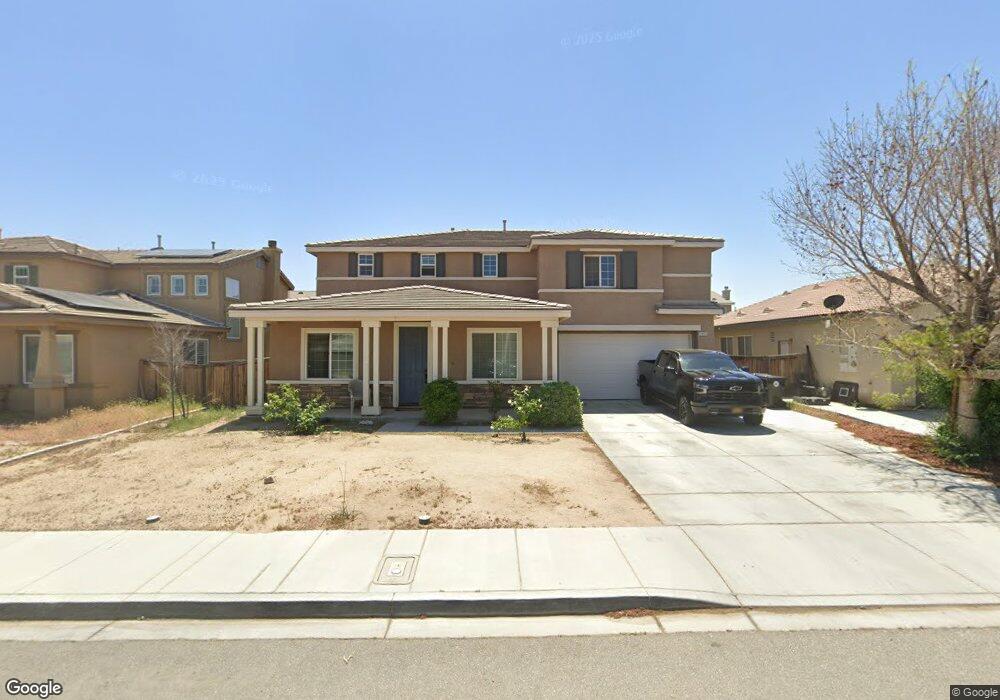
11955 Iverson St Victorville, CA 92392
Mesa Linda NeighborhoodEstimated Value: $484,471 - $568,000
5
Beds
3
Baths
3,447
Sq Ft
$154/Sq Ft
Est. Value
About This Home
This home is located at 11955 Iverson St, Victorville, CA 92392 and is currently estimated at $529,118, approximately $153 per square foot. 11955 Iverson St is a home located in San Bernardino County with nearby schools including Vista Verde Elementary School, Quail Valley Middle School, and Serrano High School.
Ownership History
Date
Name
Owned For
Owner Type
Purchase Details
Closed on
Oct 5, 2011
Sold by
Blue Star Ventures I Llc
Bought by
Wong Chen Charles Wei and Wong Chen Teresa
Current Estimated Value
Purchase Details
Closed on
Jul 31, 2011
Sold by
U S Bank National Association Nd
Bought by
Blue Star Ventures I Llc
Purchase Details
Closed on
Aug 16, 2010
Sold by
Munguia Hector
Bought by
U S Bank National Association Nd
Purchase Details
Closed on
Jan 17, 2008
Sold by
Munguia Elia
Bought by
Munguia Hector
Purchase Details
Closed on
Nov 8, 2007
Sold by
Beazer Homes Holdings Corp
Bought by
Munguia Hector
Home Financials for this Owner
Home Financials are based on the most recent Mortgage that was taken out on this home.
Original Mortgage
$316,205
Interest Rate
7.15%
Mortgage Type
Purchase Money Mortgage
Create a Home Valuation Report for This Property
The Home Valuation Report is an in-depth analysis detailing your home's value as well as a comparison with similar homes in the area
Home Values in the Area
Average Home Value in this Area
Purchase History
| Date | Buyer | Sale Price | Title Company |
|---|---|---|---|
| Wong Chen Charles Wei | $170,000 | Spl Title Services | |
| Blue Star Ventures I Llc | $123,000 | Orange Coast Title Company | |
| U S Bank National Association Nd | $147,920 | Accommodation | |
| Munguia Hector | -- | Fidelity National Title Co | |
| Munguia Hector | $316,500 | Fidelity National Title Co |
Source: Public Records
Mortgage History
| Date | Status | Borrower | Loan Amount |
|---|---|---|---|
| Previous Owner | Munguia Hector | $316,205 |
Source: Public Records
Tax History Compared to Growth
Tax History
| Year | Tax Paid | Tax Assessment Tax Assessment Total Assessment is a certain percentage of the fair market value that is determined by local assessors to be the total taxable value of land and additions on the property. | Land | Improvement |
|---|---|---|---|---|
| 2025 | $2,491 | $217,298 | $25,121 | $192,177 |
| 2024 | $2,491 | $213,037 | $24,628 | $188,409 |
| 2023 | $2,462 | $208,860 | $24,145 | $184,715 |
| 2022 | $2,406 | $204,765 | $23,672 | $181,093 |
| 2021 | $2,364 | $200,750 | $23,208 | $177,542 |
| 2020 | $2,336 | $198,692 | $22,970 | $175,722 |
| 2019 | $2,290 | $194,796 | $22,520 | $172,276 |
| 2018 | $2,249 | $190,976 | $22,078 | $168,898 |
| 2017 | $2,211 | $187,231 | $21,645 | $165,586 |
| 2016 | $2,167 | $183,560 | $21,221 | $162,339 |
| 2015 | $2,124 | $180,803 | $20,902 | $159,901 |
| 2014 | $2,094 | $177,262 | $20,493 | $156,769 |
Source: Public Records
Map
Nearby Homes
- 11786 Alana Way
- 11834 Ballina St
- 11660 Echo Glen
- 0 395 Hwy Unit HD24067189
- 0 Hwy 395 Unit HD24040654
- 0 395 Hwy Unit 542190
- 11736 Ballina St
- 12918 Echo Valley St
- 11952 Olivine Rd
- 12952 Claremore St
- 12569 Mesa View Dr
- 0 Highway 395 Unit HD25171127
- 0 Highway 395 Unit HD25120289
- 0 Highway 395 Unit CV24228214
- 12766 Brookdale St
- 12776 Berrydale St
- 11975 Forest Park Ln
- 11785 Forest Park Ln
- 12862 Fencerider Way
- 13039 Woodhill St
- 11967 Iverson St
- 11943 Iverson St
- 11954 Nyack Rd
- 11979 Iverson St
- 11939 Iverson St
- 11966 Nyack Rd
- 11942 Nyack Rd
- 11978 Nyack Rd
- 11938 Nyack Rd
- 11966 Iverson St
- 11952 Iverson St
- 11927 Iverson St
- 11978 Iverson St
- 11940 Iverson St
- 11982 Nyack Rd
- 11926 Nyack Rd
- 11984 Iverson St
- 11926 Iverson St
- 11995 Iverson St
- 11994 Nyack Rd