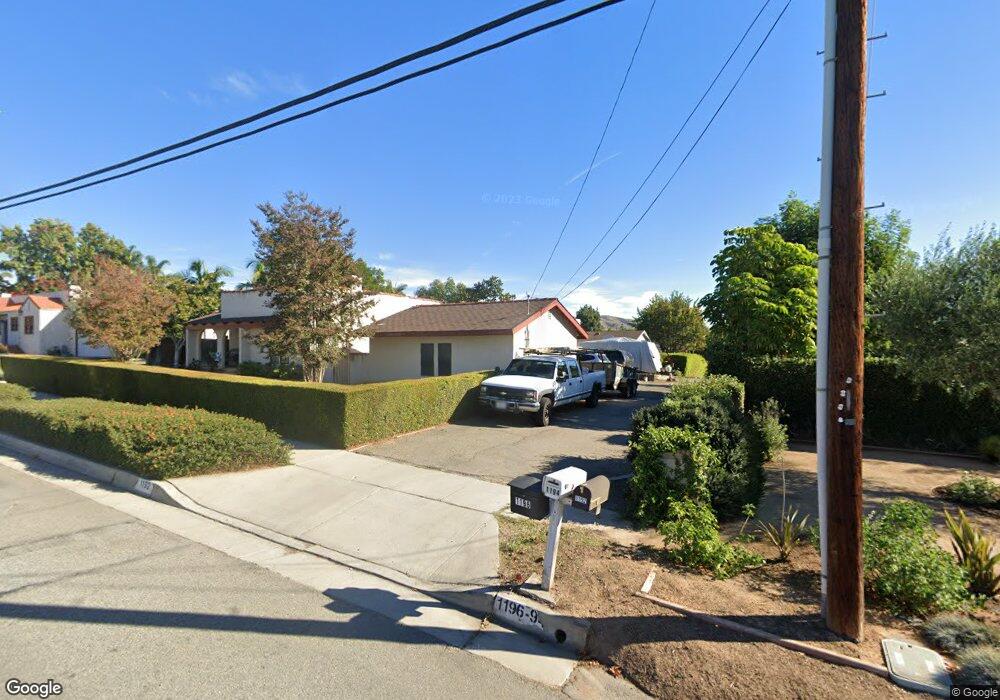
1196 N Cypress St La Habra, CA 90631
Estimated Value: $948,000 - $1,028,000
3
Beds
2
Baths
1,536
Sq Ft
$637/Sq Ft
Est. Value
About This Home
This home is located at 1196 N Cypress St, La Habra, CA 90631 and is currently estimated at $978,987, approximately $637 per square foot. 1196 N Cypress St is a home located in Orange County with nearby schools including El Cerrito Elementary School, Arbolita Elementary School, and Washington Middle School.
Ownership History
Date
Name
Owned For
Owner Type
Purchase Details
Closed on
Aug 10, 2020
Sold by
Worthington Aida Y
Bought by
Worthington Aida Y and The Aida Y Worthington Revocab
Current Estimated Value
Purchase Details
Closed on
Apr 14, 2010
Sold by
Worthington Aida Y and Worthington Aida
Bought by
Worthington Aida Y
Home Financials for this Owner
Home Financials are based on the most recent Mortgage that was taken out on this home.
Original Mortgage
$114,000
Interest Rate
4.91%
Mortgage Type
New Conventional
Purchase Details
Closed on
Jun 12, 2003
Sold by
Worthington Norman S
Bought by
Worthington Aida
Purchase Details
Closed on
Dec 1, 1995
Sold by
Terry Christian Robert
Bought by
Worthington Norman S and Worthington Aida
Home Financials for this Owner
Home Financials are based on the most recent Mortgage that was taken out on this home.
Original Mortgage
$149,700
Interest Rate
7.18%
Create a Home Valuation Report for This Property
The Home Valuation Report is an in-depth analysis detailing your home's value as well as a comparison with similar homes in the area
Home Values in the Area
Average Home Value in this Area
Purchase History
| Date | Buyer | Sale Price | Title Company |
|---|---|---|---|
| Worthington Aida Y | -- | None Available | |
| Worthington Aida Y | -- | First American Title | |
| Worthington Aida | -- | -- | |
| Worthington Norman S | $172,000 | North American Title |
Source: Public Records
Mortgage History
| Date | Status | Borrower | Loan Amount |
|---|---|---|---|
| Closed | Worthington Aida Y | $114,000 | |
| Previous Owner | Worthington Norman S | $149,700 |
Source: Public Records
Tax History Compared to Growth
Tax History
| Year | Tax Paid | Tax Assessment Tax Assessment Total Assessment is a certain percentage of the fair market value that is determined by local assessors to be the total taxable value of land and additions on the property. | Land | Improvement |
|---|---|---|---|---|
| 2025 | $3,357 | $285,561 | $146,607 | $138,954 |
| 2024 | $3,357 | $279,962 | $143,732 | $136,230 |
| 2023 | $3,277 | $274,473 | $140,914 | $133,559 |
| 2022 | $3,239 | $269,092 | $138,151 | $130,941 |
| 2021 | $3,186 | $263,816 | $135,442 | $128,374 |
| 2020 | $3,231 | $261,111 | $134,053 | $127,058 |
| 2019 | $3,146 | $255,992 | $131,425 | $124,567 |
| 2018 | $3,094 | $250,973 | $128,848 | $122,125 |
| 2017 | $3,040 | $246,052 | $126,321 | $119,731 |
| 2016 | $2,970 | $241,228 | $123,844 | $117,384 |
| 2015 | $2,886 | $237,605 | $121,984 | $115,621 |
| 2014 | $2,802 | $232,951 | $119,594 | $113,357 |
Source: Public Records
Map
Nearby Homes
- 1100 N Euclid St
- 900 Brookdale Ave
- The Sage Plan at The Birchwoods
- The Poppy Plan at The Birchwoods
- 770 N Orange St
- 766 N Orange St
- 220 Olinda Ave
- 161 W Hidden Ln
- 1445 Darlene Dr
- 950 N Walnut St
- 1241 Arbolita Dr
- 335 E Francis Ave
- 1500 Kashlan Rd
- 1573 Nabal Rd
- 506 Dorothea Rd
- 918 Dorothea Rd
- 1421 Sierra Vista Dr
- 581 W Greenwood Ave Unit 6
- 1731 Brookfield Ave
- 162 Reed Ln Unit 48
- 1220 N Cypress St
- 1194 N Cypress St
- 1192 Turndell Rd
- 11061 Magda Ln
- 11031 Magda Ln
- 1181 Turndell Rd
- 11071 Magda Ln
- 1192 N Cypress St
- 1222 N Cypress St
- 11081 Magda Ln
- 1230 N Cypress St
- 11042 Canasta Dr
- 11102 Canasta Dr
- 11011 Magda Ln
- 1188 Turndell Rd
- 1160 N Cypress St
- 11091 Magda Ln
- 1182 Turndell Rd
- 11122 Canasta Dr
- 11062 Magda Ln