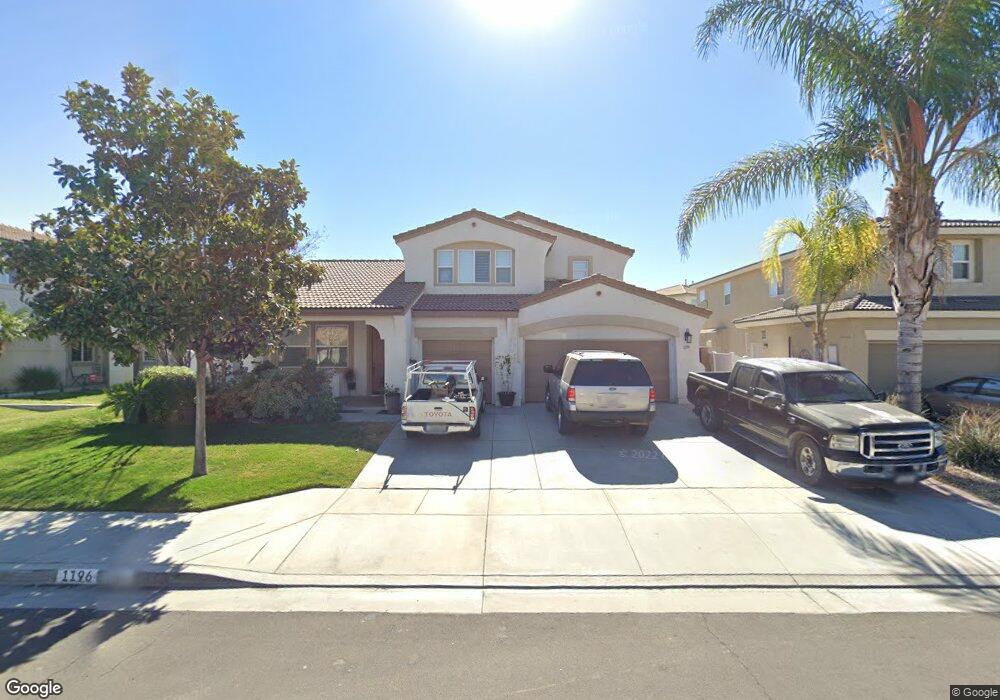
1196 Newberg Commons San Jacinto, CA 92582
De Anza NeighborhoodEstimated Value: $497,000 - $535,000
4
Beds
3
Baths
2,383
Sq Ft
$217/Sq Ft
Est. Value
About This Home
This home is located at 1196 Newberg Commons, San Jacinto, CA 92582 and is currently estimated at $516,609, approximately $216 per square foot. 1196 Newberg Commons is a home located in Riverside County with nearby schools including De Anza Elementary School, Monte Vista Middle School, and San Jacinto High School.
Ownership History
Date
Name
Owned For
Owner Type
Purchase Details
Closed on
Nov 18, 2020
Sold by
Jimenez Juan and Jimenez Bertha A
Bought by
Regalado Antonio Perez and Perez Lidia
Current Estimated Value
Purchase Details
Closed on
Sep 28, 2009
Sold by
Castro Kenny and Castro Vivian
Bought by
Jimenez Juan and Jimenez Bertha A
Home Financials for this Owner
Home Financials are based on the most recent Mortgage that was taken out on this home.
Original Mortgage
$147,283
Interest Rate
5.02%
Mortgage Type
FHA
Purchase Details
Closed on
Sep 25, 2006
Sold by
Continental Residential Inc
Bought by
Castro Kenny and Castro Vivian
Home Financials for this Owner
Home Financials are based on the most recent Mortgage that was taken out on this home.
Original Mortgage
$246,673
Interest Rate
6.3%
Mortgage Type
Stand Alone First
Create a Home Valuation Report for This Property
The Home Valuation Report is an in-depth analysis detailing your home's value as well as a comparison with similar homes in the area
Home Values in the Area
Average Home Value in this Area
Purchase History
| Date | Buyer | Sale Price | Title Company |
|---|---|---|---|
| Regalado Antonio Perez | -- | None Available | |
| Jimenez Juan | $150,000 | First American Title Company | |
| Castro Kenny | $352,500 | First American Title Company |
Source: Public Records
Mortgage History
| Date | Status | Borrower | Loan Amount |
|---|---|---|---|
| Previous Owner | Jimenez Juan | $147,283 | |
| Previous Owner | Castro Kenny | $246,673 |
Source: Public Records
Tax History
| Year | Tax Paid | Tax Assessment Tax Assessment Total Assessment is a certain percentage of the fair market value that is determined by local assessors to be the total taxable value of land and additions on the property. | Land | Improvement |
|---|---|---|---|---|
| 2025 | $8,915 | $409,158 | $48,709 | $360,449 |
| 2023 | $8,915 | $393,271 | $46,818 | $346,453 |
| 2022 | $8,536 | $385,560 | $45,900 | $339,660 |
| 2021 | $5,980 | $178,863 | $41,730 | $137,133 |
| 2020 | $5,897 | $177,030 | $41,303 | $135,727 |
| 2019 | $5,774 | $173,560 | $40,494 | $133,066 |
| 2018 | $5,654 | $170,157 | $39,701 | $130,456 |
| 2017 | $5,456 | $166,822 | $38,923 | $127,899 |
| 2016 | $5,352 | $163,552 | $38,160 | $125,392 |
| 2015 | $5,249 | $161,097 | $37,588 | $123,509 |
| 2014 | $5,012 | $157,943 | $36,852 | $121,091 |
Source: Public Records
Map
Nearby Homes
- 713 Sunnyside Blvd
- 387 Palm Ave
- 741 Amor Ln
- 591 Palm Ave
- 465 Camino Grande
- 1397 Nobel Rein Dr
- 1407 Nobel Rein Dr
- 1437 Nobel Rein Dr
- 1457 Galloping Trail
- 1467 Galloping Trail
- 1078 Peaceful Ln
- 1515 Horseshoe Ln
- 1506 Galloping Trail
- 1525 Horseshoe Ln
- 1516 Galloping Trail
- 1526 Galloping Trail
- 1536 Galloping Trail
- 1382 Braided Mane Dr
- 311 Potrero St
- 1166 Sykes Dr
- 1196 Newberg Commons
- 1206 Newberg Commons
- 1206 Newberg Commons
- 1186 Newberg Commons
- 1133 Brush Prairie Cove
- 1134 Brush Prairie Cove
- 1216 Newberg Commons
- 1176 Newberg Commons
- 1176 Newberg Commons
- 1197 Newberg Commons
- 1197 Newberg Commons
- 1207 Newberg Commons
- 1187 Newberg Commons
- 1187 Newberg Commons
- 1166 Newberg Commons
- 1217 Newberg Commons
- 1143 Brush Prairie Cove
- 1226 Newberg Commons
- 1226 Newberg Commons
- 1217 Newberg Commons
Your Personal Tour Guide
Ask me questions while you tour the home.