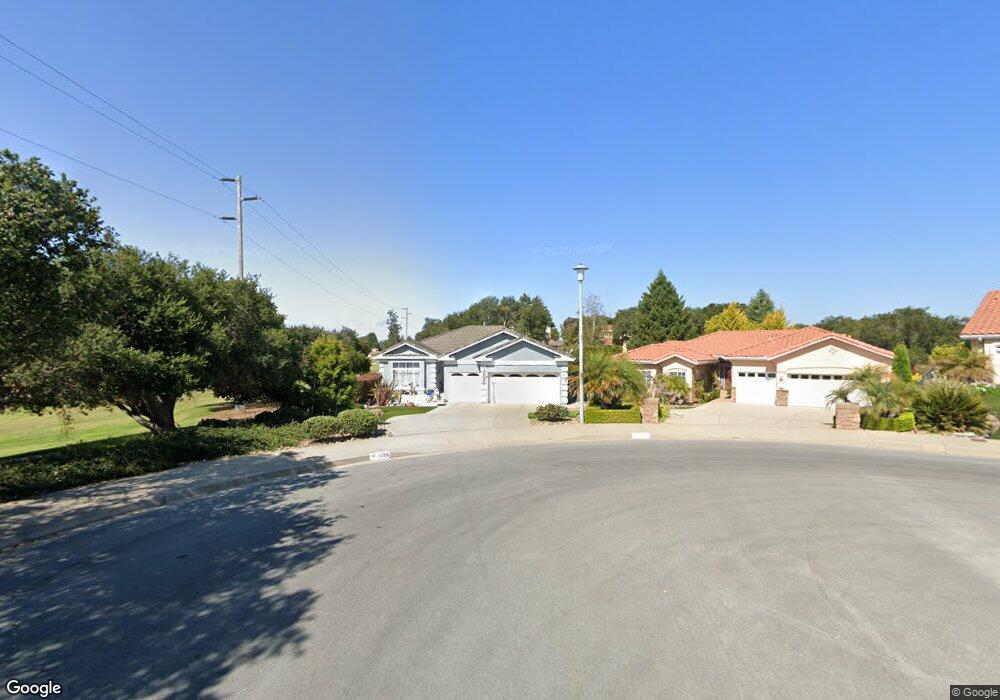
1196 Oakmont Place Nipomo, CA 93444
Blacklake NeighborhoodEstimated Value: $1,013,870 - $1,169,000
2
Beds
2
Baths
2,074
Sq Ft
$517/Sq Ft
Est. Value
About This Home
This home is located at 1196 Oakmont Place, Nipomo, CA 93444 and is currently estimated at $1,071,468, approximately $516 per square foot. 1196 Oakmont Place is a home located in San Luis Obispo County with nearby schools including Dorothea Lange Elementary School, Mesa Middle School, and Nipomo High School.
Ownership History
Date
Name
Owned For
Owner Type
Purchase Details
Closed on
Jan 26, 2004
Sold by
Knablein Robert C and Kenworthy Knablein Joy
Bought by
Zehm Hans D and Zehm Dorothy J
Current Estimated Value
Home Financials for this Owner
Home Financials are based on the most recent Mortgage that was taken out on this home.
Original Mortgage
$40,000
Interest Rate
5.82%
Mortgage Type
Purchase Money Mortgage
Purchase Details
Closed on
Sep 30, 2002
Sold by
Marsh William G and Marsh Doreen
Bought by
Knablein Robert C and Kenworthy Knablein Joy
Home Financials for this Owner
Home Financials are based on the most recent Mortgage that was taken out on this home.
Original Mortgage
$300,000
Interest Rate
4.38%
Purchase Details
Closed on
Nov 18, 1997
Sold by
Blacklake Estates Partners Lp
Bought by
Marsh William G and Marsh Doreen
Home Financials for this Owner
Home Financials are based on the most recent Mortgage that was taken out on this home.
Original Mortgage
$238,500
Interest Rate
4.75%
Create a Home Valuation Report for This Property
The Home Valuation Report is an in-depth analysis detailing your home's value as well as a comparison with similar homes in the area
Home Values in the Area
Average Home Value in this Area
Purchase History
| Date | Buyer | Sale Price | Title Company |
|---|---|---|---|
| Zehm Hans D | $575,000 | First American Title Company | |
| Knablein Robert C | $530,000 | Fidelity Title Company | |
| Marsh William G | $270,000 | First American Title Ins Co |
Source: Public Records
Mortgage History
| Date | Status | Borrower | Loan Amount |
|---|---|---|---|
| Closed | Zehm Hans D | $40,000 | |
| Previous Owner | Knablein Robert C | $300,000 | |
| Previous Owner | Marsh William G | $238,500 |
Source: Public Records
Tax History Compared to Growth
Tax History
| Year | Tax Paid | Tax Assessment Tax Assessment Total Assessment is a certain percentage of the fair market value that is determined by local assessors to be the total taxable value of land and additions on the property. | Land | Improvement |
|---|---|---|---|---|
| 2025 | $4,891 | $367,221 | $159,660 | $207,561 |
| 2024 | $4,856 | $360,022 | $156,530 | $203,492 |
| 2023 | $4,856 | $352,963 | $153,461 | $199,502 |
| 2022 | $4,809 | $346,043 | $150,452 | $195,591 |
| 2021 | $3,647 | $339,258 | $147,502 | $191,756 |
| 2020 | $3,605 | $335,780 | $145,990 | $189,790 |
| 2019 | $3,582 | $329,197 | $143,128 | $186,069 |
| 2018 | $3,538 | $322,743 | $140,322 | $182,421 |
| 2017 | $3,466 | $316,416 | $137,571 | $178,845 |
| 2016 | $3,270 | $310,213 | $134,874 | $175,339 |
| 2015 | $3,222 | $305,555 | $132,849 | $172,706 |
| 2014 | $3,103 | $299,570 | $130,247 | $169,323 |
Source: Public Records
Map
Nearby Homes
- 1150 Redberry Place
- 1337 Black Sage Cir
- 639 Barberry Way
- 1276 Pomeroy Rd
- 1060 Dawn Rd
- 1225 Dawn Rd
- 940 Calle Fresa
- 462 Camino Perillo
- 1024 Maggie Ln
- 1790 Calle Laguna
- 1354 Trail View Place
- 1084 Emma Ln
- 808 Albert Way
- 708 Albert Way
- 961 Jacqueline Place
- 977 Jacqueline Place
- 1441 Vicki Ln
- 1539 Vista Tesoro Place
- 1255 Viva Way
- 1010 1012 Upper Los Berros Rd
- 1190 Oakmont Place
- 1184 Oakmont Place Unit 1
- 415 Colonial Place
- 410 Colonial Place
- 1178 Oakmont Place
- 1172 Oakmont Place
- 425 Colonial Place
- 1166 Oakmont Place Unit 1
- 435 Colonial Place
- 1160 Oakmont Place Unit 1
- 430 Colonial Place
- 440 Colonial Place
- 445 Colonial Place
- 1148 Oakmont Place Unit 1
- 450 Colonial Place Unit 1
- 460 Links Dr
- 455 Colonial Place
- 470 Links Dr
- 1142 Oakmont Place Unit 1
- 480 Links Dr